 |
What is Technical Analysis |
| << BEYOND FUNDAMENTAL ANALYSIS |
| Indicators with Economic Justification >> |

Investment
Analysis & Portfolio Management
(FIN630)
VU
Lesson
# 8
TECHNICAL
ANALYSIS
Technical
analysis is entirely different from
the fundamental approach to "security
analysis".
Consider
the following quotations from
popular press articles on technical
analysis:
"Engage
a technical analyst in a conversation about his art,
and you soon feel
you're in the
shadowy
saloon from Star Wars, where
freakish aliens lounge about
speaking strange
languages."
"Spend
some time with a technical
analyst and you almost need
a Technical-to-English
translation
guide. Conversations art full of
references to support and resistance
levels, Fibonacci
retracements,
double bottoms and moving
averages."
Although
the technical approach to common stock
selection is the oldest approach (dating
back to
the
late 1800s), it remains controversial.
The techniques discussed in this
chapter appear at
first
glance
to have considerable merit, because
they seem intuitive plausible,
but they have
been
severely
challenged in the last three
decades by evidence supporting the
Efficient Market
Hypothesis.
Despite Burton Malkiel's (a well -
known proponent of efficient markets)
admission
that
"the market is not a perfect
random walk," the-extensive
evidence concerning the efficiency
of
the
market has challenged the
validity of technical analysis
and -the likelihood of its
success.
Those
learning about investments will in all
likelihood be exposed to technical
analysis,
because
numerous investors, investment / advisory firms,
and the popular press talk
about it and use
it.
Furthermore, it may produce
some insights into dimension
of the market. In fact, technical
analysis
is becoming increasingly interrelated
with behavioral finance, a
popular field of
study
today.
In effect, technical indicators are
being used to measure investor
emotions.
Even if this
approach is incorrect, many
investors act as if it were
correct. Therefore, the prudent
course
of action is to study this topic, or
indeed any other recommended
approach to making
investing
decisions, and try to make
an objective evaluation of its
validity and usefulness. At
the very
least,
an informed investor will be in a Better
position to understand what is
being said, or
claimed,
and
better able to judge the
validity of the
claims.
Although
technical analysis can be
applied to bonds, currencies
and commodities as well as
to
common
stocks, technical analysis typically
involves the aggregate stock
market, industry
sectors,
or
individual common stocks.
What
is Technical Analysis?
Technical
analysis can be defined as the use of
specific market-generated data for
the analysis of
both
aggregate stock prices
(market indices or industry
averages) and individual
stocks. Martin J.
Pring,
in his book Technical Analysis,
states:
"The
technical approach to investing is essentially a
reflection of the idea that prices move in
trends
which
are determined by the changing attitudes
of investors towards a variety of
economic,
monetary,
political and psychological forces.
The art of technical
analysis for it is an art is to
identify
trend
changes at an early stage and to
maintain an investment posture
until the weight of the
evidence
indicates
that the trend is
reversed."
Technical
analysis is sometimes called
market or internal analysis,
because it utilizes the record
of
the
market itself to attempt to
assess the demand for,
and supply of, shares of a
stock or the entire
59

Investment
Analysis & Portfolio Management
(FIN630)
VU
market.
Thus, technical analysts believe that
the market itself is its own
best source of data--as
they
say, "let the market tell
its own story." The theory
of technical analysis is that the
price
movement
of a security captures all
the information about that
security.
Economics
teaches us that prices are
determined by the interaction of demand
and. supply.
Technicians do
not disagree, but argue
that it is extremely difficult to
assess all the factors
that
influence
demand and supply. Since
not all investors are in
agreement on price, the
determining
factor at
any point in time is the net
demand (or lack thereof) for a
stock based on how
many
investors
are optimistic or pessimistic. Furthermore,
once the balance of investors
becomes
optimistic
(pessimistic), this mood is
likely to continue for the near
term and can be detected
by
various
technical indicators. As the chief market
technician of one New York
firm says, "All I
care
about
is how people feel about
those particular stocks as shown by
their putting money in and
taking
their
money out."
Technical
analysis is based on published market data as
opposed to fundamental data,
such as
earnings,
sales, growth rates, or government
regulations. Market data primarily
include the price of
a
stock or a market index and
volume data (number of shares
traded). Many technical
analysts
believe
that only such market data,
as opposed to fundamental data, are
relevant. For example, they
argue
that accounting data are
subject to all types of limitations
and ambiguities, an
argument.
Recall that in
fundamental analysis, the dividend
discount model and the
multiplier mode
produce
an
estimate of a stock's intrinsic
value, which is then
compared to the market
price.
Fundamentalists
believe that their data,
properly evaluated, can be
used to estimate the
intrinsic
value
of a stock. Technicians, on the other
hand, believe that it is
extremely difficult to
estimate
intrinsic
value and virtually
impossible to obtain and analyze good
information consistently. In
particular,
they are dubious about the
value to be derived from an
analysis of published financial
statements.
Instead, they focus on market data as an
indication of the forces of supply
and demand
for a
stock or the market.
Technicians
believe that the process by
which prices adjust to new
information is one of a
gradual
adjustment toward
a new (equilibrium) price. As the
stock adjusts from its old
equilibrium level to
its
new level, the price tends
to move in a trend. The central concern
is not why the change
is
taking
place, but rather the very
fact that it is taking place
at all. Technical analysts
believe that
stock
prices show identifiable trends
that can be exploited by investors.
They seek to identify
changes
in the direction of a stock and take a
position in the stock to take
advantage of the trend.
The
following points summarize
technical analysis:
1. Technical
analysis is based on published
market data and focuses on
internal factors by
analyzing
movements in the aggregate
market, industry average, or
stock. In contrast,
fundamental
analysis focuses on economic and
political factors, which are
external to
the
market itself.
2.
The focus of technical
analysis is on identifying changes in
the direction of stock
prices which
tend to
move in trends as the stock
price adjusts to a new
equilibrium level. These
trends
can
be analyzed, and changes in trends
detected, by studying the action of
price
movements
and trading volume across
time. The emphasis is on likely
price changes.
3.
Technicians, attempt to assess the
overall situation concerning stocks by
analyzing
technical
indicators, such as breadth of market
data, market sentiment, momentum,
and
other
indicators.
60

Investment
Analysis & Portfolio Management
(FIN630)
VU
Perhaps
the bottom line can be stated
as: Stock prices (either for
the market or individual
stocks)
tend to
move in trends, and these
trends take time to unfold.
Such trends can be spotted
by careful
analysis,
and acted upon by buying and
selling.
A
framework for Technical
Analysis:
Technical
analysis can be applied to
both an aggregate of prices
(the market as a whole or
industry
averages)
and individual stocks.
Technical analysis includes the use of
graphs (charts) and
technical
indicators.
Price
and volume are the primary
tools of the pure technical analyst, and the chart is
the most
important
mechanism for displaying
this information. Technicians believe
that the forces of
supply
and demand result in
particular patterns of price behavior,
the most important of which
is
the trend or
overall direction in price. Using a
chart, the technician hopes to identify
trends and
patterns
in stock prices that provide trading
signals.
Volume
data are used to gauge the
general in the market and to
help assess its trends. The
evidence
seems
to suggest that rising (falling)
stock prices are usually
associated with rising
(falling)
volume.
If stock prices rose but
volume activity did not keep
pace, technicians would be
skeptical
about
the upward trend. An upward surge on contracting
volume would be particularly
suspected.
A
downside movement from some
pattern or holding point
accompanied by heavy volume
would
be
taken as a bearish
sign.
We
first consider stock price
and volume technique, often
referred to as charting. However,
technical
analysis has evolved over
time, so that today it is much more
than the charting of
individual
stocks or the market. In particular Technical
indicators are used to
assess market
conditions
(breadth) and investors'
sentiments. It also includes "contrary
analysis" which is an
intellectual
process more than a
technique. The idea behind
contrary is go against the crowd
when
those
in the crowd start thinking
alike.
Charts
of Price Patterns:
To
assess individual stock-price movements, technicians
generally rely on charts or
graphs of
price
movements and on relative strength
analysis. The charting of
price patterns is one of
the
classic
technical analysis techniques. Technicians
believe that stock prices
move in trends, with
price
changes forming patterns
that can be recognized and
categorized. By visually assessing
the
forces
of supply and demand,
technicians hope to be able to predict
the likely direction of
future
movements.
The most basic measure of a
stock's direction is the trendline,
which simply shows
the direction the
stock is moving. If demand is
increasing more rapidly than
supply and the
stock
shows
successively higher low points, it is in
an uptrend. Consistently lower highs indicate
that
supply
is increasing more rapidly,
and the stock is in a downtrend.
Obviously, investors seek to
buy
in an
uptrend and sell on a downtrend.
Technicians
seek to identify certain
signals in a chart of stock prices,
and use certainly
terminology
to
describe the events. A
support level is the level
of price (or, more
correctly, a price range) at
which
a
technician expects a significant increase
in the demand for a stock.
In other words, a lower
bound
on
price where it is expected that buyers
will act, supporting the
price and preventing
additional price
declines.
A resistance level, on the other
hand, is the level of price
(range) at which a technician
expects
a
significant increase in the supply of a
stock. In other words, an
upper bound on price where
sellers are
expected
to act, providing a resistance to any
further rise in
price.
Support
levels tend to develop when
profit taking causes a
reversal in a stock's price
following an
increase;
investors who did not
purchase earlier are now
willing to buy at this
price, which becomes
a
61
Investment
Analysis & Portfolio Management
(FIN630)
VU
support
level. Resistance levels tend to
develop after a stock
declines from a higher level.
Investors are
waiting to
sell the stocks at a certain
recovery point. At certain price levels,
therefore, a significant
increase
in supply occurs, and the
price will encounter
resistance moving beyond this
level.
As
noted, a trendline is a line drawn on a
chart to identify a trend. If a
trend exhibits support
and
resistance
levels simultaneously that appear to be well
defined, the trend lines
are referred to as
channel
lines,
and price is said to move
between the upper channel
line and the lower channel
line.
Momentum
is
used to indicate the speed
with which prices are
changing, and a number of
measures
of momentum
exist, referred to as momentum
indicators. When a change in
direction occurs in a
short-term
trend, technicians say that a
reversal has occurred. A
correction occurs when the
reversal
involves
only a partial retracing of
the prior movement. Corrections
may be followed by periods
of
consolidations
with the initial trend
resuming following the
consolidation..
Technical
analysts rely primarily on
line charts, bar charts,
and point-and-figure charts,
although
other
types of charts are also
used, such as candlestick
charts.
Bar
Charts:
One
of the most popular charts
in technical analysis bar
charts, are plotted with
price on the vertical
axis
and
time on the horizontal axis.
Each day's price movements
is represented by a vertical bar
whose top
(bottom)
represents the high (low)
price for the
day.
(A
small, horizontal tick is
often used to design the
closing price for the
day). The bottom of a bar
chart
usually
shows the trading volume for
each day, permitting the
simulations observation of noth
price and
volume activity.
The Wall Street Journal
carries a bar chart of the
Dow Jones Averages each
day on the
page
with New York Stock
Exchange (NYSE)
quotations.
The
technician using charts will
search for patterns in the
chart that can be used to
predict future price
moves.
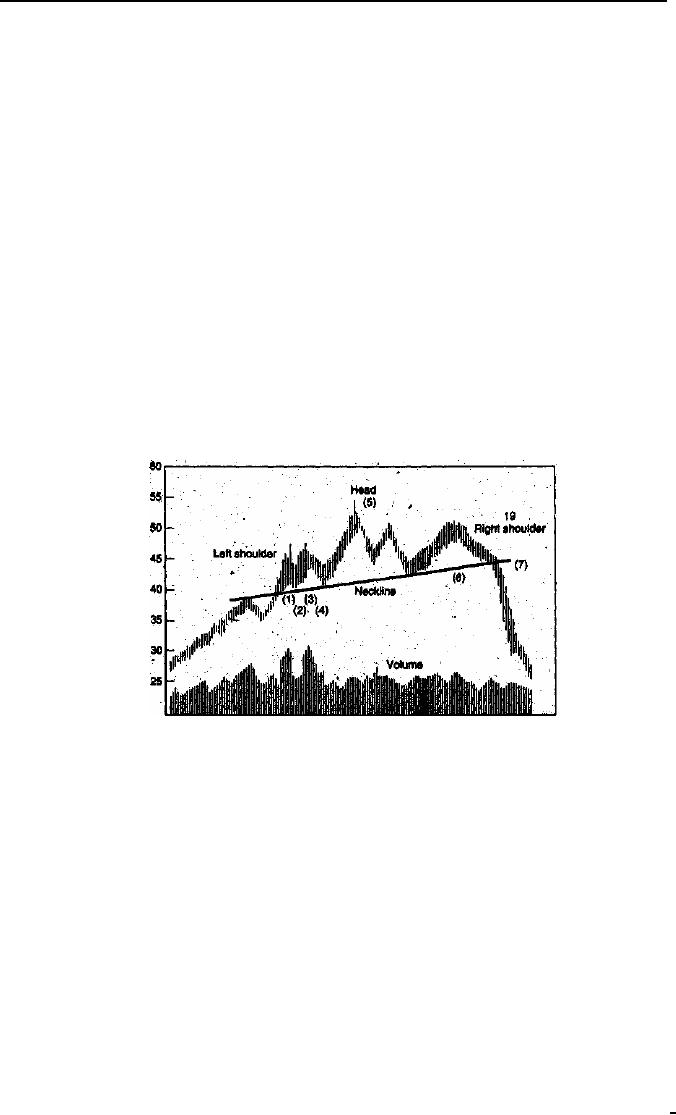
The strong uptrend occurring
over period of months. This
trend ended with a rally on
high
volume
that forms parts of the
left shoulder of a famous
chart pattern called a Head
and Shoulders
patterns.
The
left shoulder shows
initially strong demand followed by a
reaction on lower volume (2), and then
a
second
rally, with strong volume;
carrying prices still higher
(3). Profit taking again causes
prices to fall
to
the so-called neckline (4),
thus completes the left
shoulder. A rally occurs,
but this time on
low
volume,
and again prices sink
back to the neckline. This
is the head (5). The last
step is the formation
of
the
right shoulder, which occurs
with light volume (6). Growing
weakness can be identified as
the price
approaches
the neckline. As an be seen, a
downside breakout occurs on
heavy volume, which
technicians
consider to be sell
signal.
62
Investment
Analysis & Portfolio Management
(FIN630)
VU
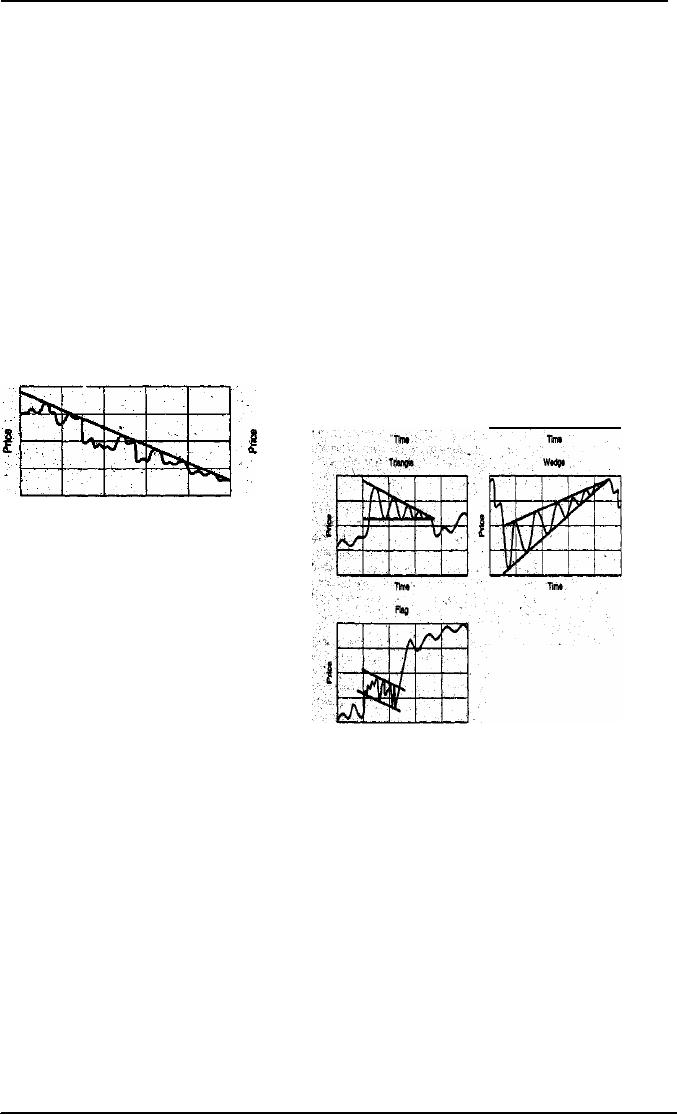
Technicians
have considered a very large
number of such patterns.
Some of the possible
patterns include
flags,
pennants, gaps (of more
than one type), triangles of
various types (e.g.,
symmetrical, ascending,
descending,
and inverted), the inverted
saucer or dome, the triple
op, the compound fulcrum,
the rising
(and
falling) wedge, the
broadening bottom, the
duplex horizontal. Rectangles,
and the inverted V.
Obviously,
numerous patterns are
possible and can usually be
found on a chart of stock
prices. It is also
obvious
that most, if not all, of
these patterns are much
easier to identify in hindsight
than at the time
they
are
actually occurring.
Point-and-Figure
Charts:
Technicians
also use point-and-figure charts,
types of charts are more
complex in that they show
only
significant price changes,
and volume is not shown at
all. The user determines
what a
significant
price change is and what
constitutes a price reversal {$2, $3, $4, and so
forth).
Although
the horizontal axis still
depicts time, specific calendar time is
not particularly
important
with the passage of time is basically
ignored. (Some chartists do show the
month in
which
changes occur.)
These
are the most important
price patterns for investors
who want to temper their
hunches
and
the timing of their buy and
sell decisions with solid
empirical data.
An X is
typically used to show upward movements,
whereas an O is used for
downward
movements.
Each X or O on a particular chart
may represent Rs. 1 movements,
Rs. 2
movements,
Rs. 5 movements, and so on,
depending on how much movement is
considered
significant
for that stock. An X or O is recorded
only when the price
moves by the specified amount.
Moving
Average:
A Moving
Average is a
smoothed presentation of underlying
historical data. Each
data
point
is the arithmetic average of a
portion of the previous
data. A ten-day moving
average
measures
the average over the
previous ten days.
Regardless of the time
period used, each
day a
new observation is included in
the calculation and the
oldest is dropped, so a constant
number
of points are always being
averaged.
63

Investment
Analysis & Portfolio Management
(FIN630)
VU
Advocates
of moving average in the
stock selection believe that
changes in the slope of
the
line
are important. A stock whose
twenty-day moving average
has been trending up
might
become
a candidate for sale if the
line turns downward.
64
Table of Contents:
- INTRODUCTION OF INVESTMENT
- THE ROLE OF THE CAPITAL MARKETS
- THE NASDAQ STOCK MARKET
- Blue Chip Stocks, Income Stock, Cyclical Stocks, Defensive Stocks
- MARKET MECHANICS
- FUNDAMENTAL STOCK ANALYSIS
- BEYOND FUNDAMENTAL ANALYSIS
- What is Technical Analysis
- Indicators with Economic Justification
- Dow Theory
- VALUATION PHILOSOPHIES
- Ratio Analysis
- INVESTMENT RATIOS
- Bottom-Up, Top-Down Approach to Fundamental Analysis
- The Industry Life Cycle
- COMPANY ANALYSIS
- Analyzing a Companys Profitability
- Objective of Financial Statements
- RESEARCH PHILOSPHY
- What Is An Investment Company
- Exchange-Traded Funds (ETFs)
- COMMON STOCK: ANALYSIS AND STRATEGY
- THE EFFICIENT MARKET HYPOTHESIS (EMH)
- Behavioral Finance
- MARKET INDEXES
- POPULAR INDEXES
- BOND PRINCIPLES
- BOND PRICING AND RETURNS
- Accrued Interest
- BOND RISKS
- UNDERSTANDING RISK AND RETURN
- TYPES & SOURCES OF RISK
- Measuring Risk
- ANALYZING PORTFOLIO RISK
- Building a Portfolio Using Markowitz Principles
- Capital Market Theory: Assumptions, The Separation Theorem
- Risk-Free Asset, Estimating the SML
- Formulate an Appropriate Investment Policy
- EVALUATION OF INVESTMENT PERFORMANCE
- THE ROLE OF DERIVATIVE ASSETS
- THE FUTURES MARKET
- Using Futures Contracts: Hedgers
- Financial Futures: Short Hedges, Long Hedges
- Risk Management, Risk Transfer, Financial Leverage
- OVERVIEW