 |
Production
and Operations Management
MGT613
VU
Lecture
12
In
our last discussion we focused on the
objectivity and importance of Product and Service
Design. We
also
went through the primary and
secondary reasons due to which
organizations opt for
designing a
new
product or offering of a new service. We
also talked about the strategy
for designing of new
products
and services. We investigated the
legal, ethical and environmental
regulations. We also
formulated
a design strategy and also discussed
guidelines, which the organizations
must fulfill in order
to
achieve competitive advantage through
designing of effective productive
systems.
Critical
Issues in Product and
Service Design
An
organization needs to decide about the
following critical issues in
developing its product and
service
design.
How
much standardization
Product/service
reliability
Range
of operating conditions
Product/service
life cycles
Standardization
Standardization
is the extent to which there is an
absence of variety in a product, service
or process.
Standardized
products are immediately available to
customers. You go to a market and request
for a
charger
for your cellular phone, the shopkeeper
would ask for the model,
make and deliver you as
special
product which is made by
your cell phone company or by an
independent manufacturer,
who
provides
a standardized compatible model.
Advantages
of Standardization
1.
Fewer parts to deal with in
inventory & manufacturing .The
trend is to use the same
components for
different
models of products or even in services side, the
data of a customer once
taken as input can
be
utilized for other
services.
2.
Design costs are generally
lower (the standardized product
has a proven track record, so there is
no
need
to check its safety and reliability
features from square 1, its
true, its tested and
verified on
prototype
models before being
marketed)
3.
Reduced training costs and
time. An important advantage and can
improve PRODUCTIVITY.
4.
More routine purchasing, handling,
and inspection procedures
(These indicate a decrease in
cost and
can
improve reliability as well as
over all design and manufacturing
processes)
5.
Orders fillable from
inventory, no need to carry
extra safety stock levels as
compatible
components/parts
can be used. Any product
registering lower sales can
be phased out but
its
components
may be reused in an other more
popular product even Softwares in
cellular phones,
hands
free arrangement etc)
6.
Opportunities for long
production runs and automation
.Uninterrupted stock of components
available,
so production can be controlled
and if possible a demand forecast
may be used.
7.
Need for fewer parts
justify increased expenditures on
perfecting designs and improving
quality
control
procedures. The company can
free up its inventory
carrying costs and use it on
increasing
its
long term tangible and intangible
quality standards
Disadvantages
of Standardization
1.
Designs may be frozen ( Standardized)
with too many imperfections
remaining ( An existing
shortcoming
may never be removed because of
this leading to product or component
failure,
catalytic
converter failure led to a number of
good cars in 1980s).
50
Production
and Operations Management
MGT613
VU
2.
High cost of design changes
increases resistance to improvements
(associated with its lack
of
confidence
on the design side as well as
outsourcers, who provide design
services).
3.
Reduction in Variety which
leads to decreased variety
results in less consumer appeal.
This also at
times
lead to the competitor producing a
better product or greater variety
which itself is a feature
of
lean
production.
Mass
Customization
Mass
customization is a strategy of producing standardized
goods or services, but
incorporating some
degree
of customization through delayed
differentiation and modular
design.
Delayed
Differentiation is the postponement tactic.
Producing but not quite
completing a product or
service
until customer preferences or
specifications are known, a pc
manufacturer employed this
technology
and improved its time of
delivery. This led to new
concepts of marketing and
manufacturing
to
register higher profits and
revenues.
Product/Service
Reliability
Reliability:
The ability of a product,
part, or system to perform
its intended function under
a prescribed
set
of conditions
Failure:
Situation in which a product,
part, or system does not
perform as intended
Normal
operating conditions: The
set of conditions under
which an item's reliability is
specified e.g. an
automobile
designed for operation Europe
may not fulfill its
intended service in Pakistan. SO IT
WOULD
FAIL AND BE LESS RELIABLE
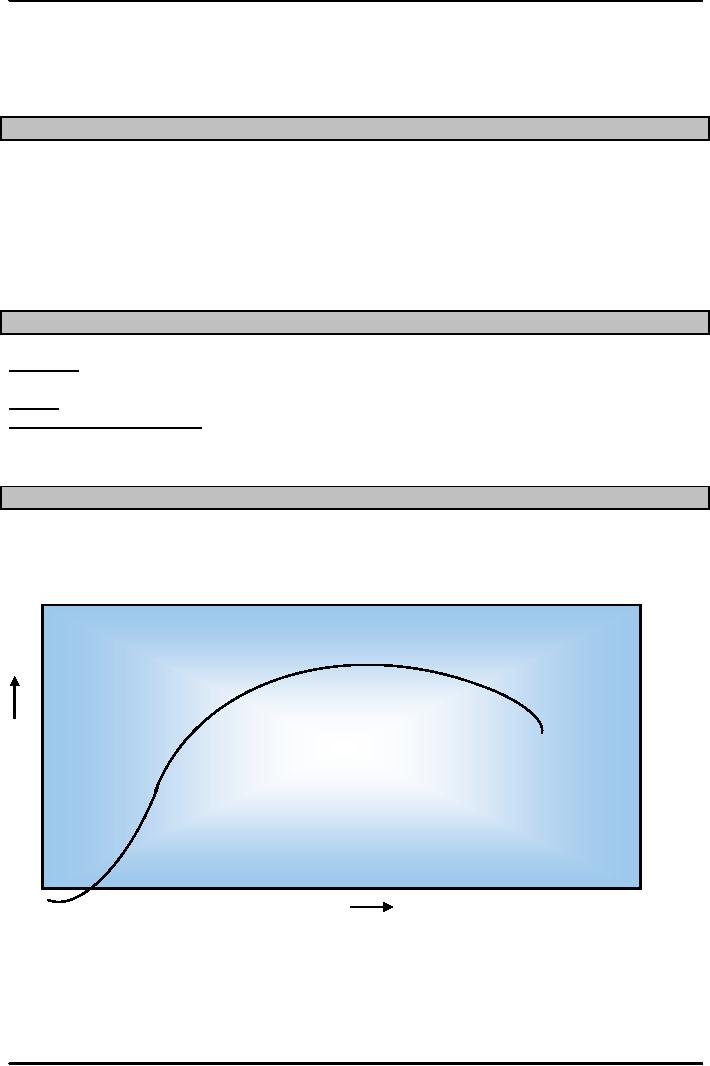
Life
Cycles of Products or Services
We
often hear the term short and long
product lives which reflect
upon the idea how product
lives are
governed
by Technological rate of change. In other
words the need and utility of the Product
gets
severely
reduced. E.g. VCR no longer
enjoys the source of entertainment it
enjoyed in 1970s to
1990s.
Most
of the products exhibit Product Life
cycles except wooden pencils, paper
clips, nails, knives
etc.
Saturation
Demand
Maturity
Decline
Growth
Introduction
Time
Life
Cycles
of Products or Services normally
entail the following
phases.
1.
INTRODUCTION PHASE: When items
are first introduced, it is
received with
curiosity.
Demand
is low in the beginning then
when buyers begin familiar
with the product and see it as
a
reliable
and good buy, they start
buying it.
51

Production
and Operations Management
MGT613
VU
2.
GROWTH PHASE: With the
passage of time, production and design
improvements lead to
decrease
in cost and price becomes an
attractive feature with
increase in reliability.
3.
MATURITY PHASE: When the product
reaches maturity stage its
demand can only increase
if
design
is refined or changed and some
differentiation feature is added
this may increase the
demand
but when it goes
down
4.
SATURATION PHASE: In this
phase product demand declines
and the market is
saturated
with
either a compatible product or
substitutes.
5.
DECLINE: In this phase, most
of the organizations adopt a defensive
design R&D Strategy in
an
attempt to prolong the life of the
product by employing new
packaging, redesigning
it,
improving
its reliability
As
students of Operations Management, you
may be asked to suggest the Product
Life Cycle for
Telecom
Industry constituents or in other words where
would you place cell phones,
wireless
phones,
landline phones or satellite/cable
based telephones in view of the life
cycle you just
studied.
You
can make an attempt to answer this
for Pakistan as well as other
developed countries. Can
you
appreciate
the similarities and points of
differences?
52
Table of Contents:
- INTRODUCTION TO PRODUCTION AND OPERATIONS MANAGEMENT
- INTRODUCTION TO PRODUCTION AND OPERATIONS MANAGEMENT:Decision Making
- INTRODUCTION TO PRODUCTION AND OPERATIONS MANAGEMENT:Strategy
- INTRODUCTION TO PRODUCTION AND OPERATIONS MANAGEMENT:Service Delivery System
- INTRODUCTION TO PRODUCTION AND OPERATIONS MANAGEMENT:Productivity
- INTRODUCTION TO PRODUCTION AND OPERATIONS MANAGEMENT:The Decision Process
- INTRODUCTION TO PRODUCTION AND OPERATIONS MANAGEMENT:Demand Management
- Roadmap to the Lecture:Fundamental Types of Forecasts, Finer Classification of Forecasts
- Time Series Forecasts:Techniques for Averaging, Simple Moving Average Solution
- The formula for the moving average is:Exponential Smoothing Model, Common Nonlinear Trends
- The formula for the moving average is:Major factors in design strategy
- The formula for the moving average is:Standardization, Mass Customization
- The formula for the moving average is:DESIGN STRATEGIES
- The formula for the moving average is:Measuring Reliability, AVAILABILITY
- The formula for the moving average is:Learning Objectives, Capacity Planning
- The formula for the moving average is:Efficiency and Utilization, Evaluating Alternatives
- The formula for the moving average is:Evaluating Alternatives, Financial Analysis
- PROCESS SELECTION:Types of Operation, Intermittent Processing
- PROCESS SELECTION:Basic Layout Types, Advantages of Product Layout
- PROCESS SELECTION:Cellular Layouts, Facilities Layouts, Importance of Layout Decisions
- DESIGN OF WORK SYSTEMS:Job Design, Specialization, Methods Analysis
- LOCATION PLANNING AND ANALYSIS:MANAGING GLOBAL OPERATIONS, Regional Factors
- MANAGEMENT OF QUALITY:Dimensions of Quality, Examples of Service Quality
- SERVICE QUALITY:Moments of Truth, Perceived Service Quality, Service Gap Analysis
- TOTAL QUALITY MANAGEMENT:Determinants of Quality, Responsibility for Quality
- TQM QUALITY:Six Sigma Team, PROCESS IMPROVEMENT
- QUALITY CONTROL & QUALITY ASSURANCE:INSPECTION, Control Chart
- ACCEPTANCE SAMPLING:CHOOSING A PLAN, CONSUMERS AND PRODUCERS RISK
- AGGREGATE PLANNING:Demand and Capacity Options
- AGGREGATE PLANNING:Aggregate Planning Relationships, Master Scheduling
- INVENTORY MANAGEMENT:Objective of Inventory Control, Inventory Counting Systems
- INVENTORY MANAGEMENT:ABC Classification System, Cycle Counting
- INVENTORY MANAGEMENT:Economic Production Quantity Assumptions
- INVENTORY MANAGEMENT:Independent and Dependent Demand
- INVENTORY MANAGEMENT:Capacity Planning, Manufacturing Resource Planning
- JUST IN TIME PRODUCTION SYSTEMS:Organizational and Operational Strategies
- JUST IN TIME PRODUCTION SYSTEMS:Operational Benefits, Kanban Formula
- JUST IN TIME PRODUCTION SYSTEMS:Secondary Goals, Tiered Supplier Network
- SUPPLY CHAIN MANAGEMENT:Logistics, Distribution Requirements Planning
- SUPPLY CHAIN MANAGEMENT:Supply Chain Benefits and Drawbacks
- SCHEDULING:High-Volume Systems, Load Chart, Hungarian Method
- SEQUENCING:Assumptions to Priority Rules, Scheduling Service Operations
- PROJECT MANAGEMENT:Project Life Cycle, Work Breakdown Structure
- PROJECT MANAGEMENT:Computing Algorithm, Project Crashing, Risk Management
- Waiting Lines:Queuing Analysis, System Characteristics, Priority Model