 |
THE DATA OF MACROECONOMICS (Continued ):How to construct the CPI |
| << THE DATA OF MACROECONOMICS (Continued ):Components of Expenditures |
| NATIONAL INCOME: WHERE IT COMES FROM AND WHERE IT GOES >> |

Macroeconomics
ECO 403
VU
LESSON
06
THE DATA OF
MACROECONOMICS (Continued...)
Other
Measures of Income
Net
National Product (NNP) =
·
GNP
Depreciation
National
Income (NI) =
·
NNP
Indirect Business
Taxes
Personal
Income (PI) =
·
NI
Corporate Profits
Social Insurance
Contributions
Net Interest
+
Dividends
+
Govt. Transfers to
Individuals
+
Personal Interest
Income
Disposable
Personal Income (DPI) =
·
PI
- Tax
CONSUMER
PRICE INDEX (CPI)
A
measure of the overall level
of prices
·
Published
by the Federal Bureau
of Statistics
·
Used
to
·
·
track
changes in the
typical
household's cost of
living
·
adjust
many contracts for
inflation
(i.e.
"COLAs":
Cost of Living
Adjustments)
·
allow
comparisons of dollar figures
from different years
How
to construct the
CPI
1.
Survey consumers to determine
composition of the typical
consumer's "basket" of
goods.
2.
Every month, collect data on
prices of all items in the
basket; compute cost of
basket
3.
CPI in any month
equals
Cost
of basket in that month
100
×
Cost
of basket in base
period
CPI:
an example
The
basket contains 20 pizzas
and 10 compact discs.
Prices:
Pizza
CDs
2000
$10
$15
2001
$11
$15
2002
$12
$16
2003
$13
$15
16

Macroeconomics
ECO 403
VU
For
each year, compute
·
the
cost of the basket
·
the
CPI (use 2000 as the
base year)
·
the
inflation rate from the
preceding year
Cost
of
inflation
basket
CPI
rate
2000
$350
100.0
N.A.
2001
370
105.7
5.7%
2002
400
114.3
8.1%
2003
410
117.1
2.5%
Understanding
the CPI
Example
with 3 goods
For
good i = 1, 2, 3
Ci
= the amount of good i in
the CPI's basket
Pit
= the price of good i in
month t
Et
= the cost of the CPI
basket in month t
Eb
= cost of the basket in the
base period
Et
CPI
in month t =
100
×
Eb
P1tC1 +
P2tC2 + P3tC3
=
100
×
Eb
⎡⎛
C1 ⎞
⎛
C3 ⎞
⎤
⎛
C2 ⎞
=
100
× ⎢⎜
⎟ P1t +
⎜ ⎟ P2t +
⎜ ⎟ P3t ⎥
⎢⎝
Eb ⎠
⎝
Eb ⎠
⎝
Eb ⎠
⎥
⎣
⎦
The
CPI is a weighted average of
prices.
The
weight on each price
reflects that good's
relative importance in the
CPI's basket.
Note
that the weights remain
fixed over time.
Reasons
why the CPI may overstate
inflation
Substitution
bias: The
CPI uses fixed
weights,
·
so
it cannot reflect consumers'
ability to substitute toward
goods whose relative
prices
have
fallen.
CPI
uses fixed weights.
Introduction
of new goods: The
introduction of new goods
makes consumers
better
·
off
and, in effect, increases
the real value of the
dollar. But it does not
reduce the CPI,
because
the CPI uses fixed
weights.
Unmeasured
changes in quality: Quality
improvements increase the
value of the
·
dollar,
but are often not
fully measured.
CPI
vs. GDP deflator
prices
of capital goods
·
included
in GDP deflator (if produced
domestically)
·
excluded
from CPI
prices
of imported consumer
goods
·
included
in CPI
·
excluded
from GDP deflator
the
basket of goods
17
Macroeconomics
ECO 403
VU
CPI:
fixed
·
GDP
deflator: changes every
year
·
CATEGORIES
OF THE POPULATION
Employed
·
working
at a paid job
Unemployed
·
not
employed but looking for a
job
Labor
force
·
the
amount of labor available
for producing goods and
services; all employed
plus
unemployed
persons
Not
in the labor
force
·
not
employed, not looking for
work.
Two
important labor force
concepts
unemployment
rate
·
percentage
of the labor force that is
unemployed
Unemployment
Rate = Number of Unemployed x
100
Labor
Force
labor
force participation
rate
·
the
fraction of the adult
population that `participates' in
the labor force
Labor-Force
Participation Rate =
Labor
Force x 100
Adult
Population
Suppose
·
the
population increases by 1%
·
the
labor force increases by
3%
·
the
number of unemployed persons
increases by 2%
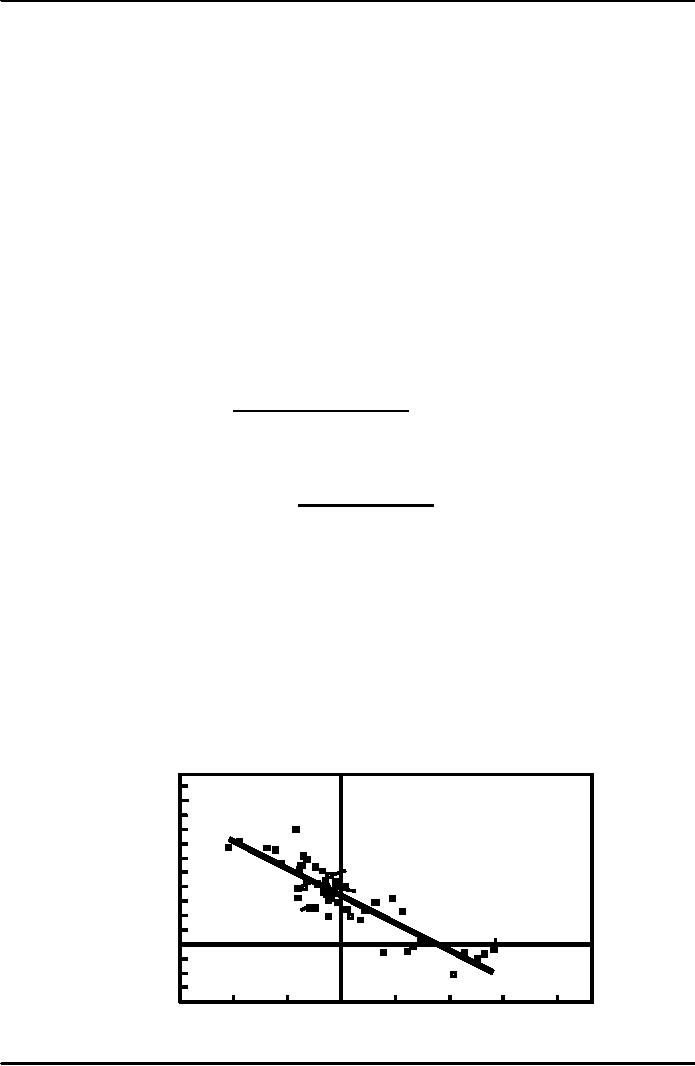
Okun's
Law
·
One
would expect a negative
relationship between unemployment
and real GDP.
·
This
relationship is clear in the
data...
Percentage
Change in Real GDP = 3% - 2 *
(change in the Unemployment
rate)
Okun's
Law states
that a
one-percent
decrease in
unemployment
is
Percentage
associated
with two
change
in
percentage
points of
real
GDP
additional
growth in real
10
GDP
8
1951
1984
6
2000
4
1999
2
1993
1975
0
-
1982
0
1
2
3
4
-
-
-
Change
in
unemployment
rate
18
Table of Contents:
- INTRODUCTION:COURSE DESCRIPTION, TEN PRINCIPLES OF ECONOMICS
- PRINCIPLE OF MACROECONOMICS:People Face Tradeoffs
- IMPORTANCE OF MACROECONOMICS:Interest rates and rental payments
- THE DATA OF MACROECONOMICS:Rules for computing GDP
- THE DATA OF MACROECONOMICS (Continued ):Components of Expenditures
- THE DATA OF MACROECONOMICS (Continued ):How to construct the CPI
- NATIONAL INCOME: WHERE IT COMES FROM AND WHERE IT GOES
- NATIONAL INCOME: WHERE IT COMES FROM AND WHERE IT GOES (Continued )
- NATIONAL INCOME: WHERE IT COMES FROM AND WHERE IT GOES (Continued )
- NATIONAL INCOME: WHERE IT COMES FROM AND WHERE IT GOES (Continued )
- MONEY AND INFLATION:The Quantity Equation, Inflation and interest rates
- MONEY AND INFLATION (Continued ):Money demand and the nominal interest rate
- MONEY AND INFLATION (Continued ):Costs of expected inflation:
- MONEY AND INFLATION (Continued ):The Classical Dichotomy
- OPEN ECONOMY:Three experiments, The nominal exchange rate
- OPEN ECONOMY (Continued ):The Determinants of the Nominal Exchange Rate
- OPEN ECONOMY (Continued ):A first model of the natural rate
- ISSUES IN UNEMPLOYMENT:Public Policy and Job Search
- ECONOMIC GROWTH:THE SOLOW MODEL, Saving and investment
- ECONOMIC GROWTH (Continued ):The Steady State
- ECONOMIC GROWTH (Continued ):The Golden Rule Capital Stock
- ECONOMIC GROWTH (Continued ):The Golden Rule, Policies to promote growth
- ECONOMIC GROWTH (Continued ):Possible problems with industrial policy
- AGGREGATE DEMAND AND AGGREGATE SUPPLY:When prices are sticky
- AGGREGATE DEMAND AND AGGREGATE SUPPLY (Continued ):
- AGGREGATE DEMAND AND AGGREGATE SUPPLY (Continued ):
- AGGREGATE DEMAND AND AGGREGATE SUPPLY (Continued )
- AGGREGATE DEMAND AND AGGREGATE SUPPLY (Continued )
- AGGREGATE DEMAND AND AGGREGATE SUPPLY (Continued )
- AGGREGATE DEMAND IN THE OPEN ECONOMY:Lessons about fiscal policy
- AGGREGATE DEMAND IN THE OPEN ECONOMY(Continued ):Fixed exchange rates
- AGGREGATE DEMAND IN THE OPEN ECONOMY (Continued ):Why income might not rise
- AGGREGATE SUPPLY:The sticky-price model
- AGGREGATE SUPPLY (Continued ):Deriving the Phillips Curve from SRAS
- GOVERNMENT DEBT:Permanent Debt, Floating Debt, Unfunded Debts
- GOVERNMENT DEBT (Continued ):Starting with too little capital,
- CONSUMPTION:Secular Stagnation and Simon Kuznets
- CONSUMPTION (Continued ):Consumer Preferences, Constraints on Borrowings
- CONSUMPTION (Continued ):The Life-cycle Consumption Function
- INVESTMENT:The Rental Price of Capital, The Cost of Capital
- INVESTMENT (Continued ):The Determinants of Investment
- INVESTMENT (Continued ):Financing Constraints, Residential Investment
- INVESTMENT (Continued ):Inventories and the Real Interest Rate
- MONEY:Money Supply, Fractional Reserve Banking,
- MONEY (Continued ):Three Instruments of Money Supply, Money Demand