 |
Production
and Operations Management
MGT613
VU
Lesson
42
SEQUENCING
Learning
Objectives
After
completing today's lecture, the
students should be able to
develop a comprehensive
understanding
of
scheduling and sequencing operations with the
help of Hungarian Methods and
Johnson Rules. The
students
would be able to understand the priority
rules along with the need of
effective scheduling and
sequencing.
The students would be able
to develop an Operations Strategy with
respect to both
Scheduling
and Sequencing.
Sequencing
Sequencing:
Determine the order in which
jobs at a work center will
be processed.
Requires
order for sequencing at all
work centers as well as sequencing at
individual work
centers.
Workstation:
An area where one person works,
usually with special equipment, on a
specialized job.
Sequencing
Job
time:
Time needed for setup and
processing of a job.
Priority
rules:
Simple heuristics (Commonsense rules)
used to select the order in
which jobs will be
processed.
1.
Local Rules ( pertaining to
single workstation)
2.
Global Rules( pertaining to multiple
workstation)
3.
Job processing times and due dates are
important pieces of
information.
4.
Job time consists of processing
time and setup times
Priority
Rules
1.
FCFS - First Come, First
Served: Jobs are processed in the
order in which they arrive
at a
machine
or work center.
2.
SPT- Shortest Processing
Time: Jobs are processed
according to processing time at
a
machine
or work center, shortest job
first.
3.
DD - Due Date: Jobs are
processed according to due
date, earliest due date
first.
4.
CR - critical ratio: Jobs
are processed according to
smallest ratio of time
remaining until
due
date to processing time
remaining.
5.
S/O - slack per operation: Jobs
are processed according to
average slack time (time
until
due
date minus remaining time to
process). Compute by dividing slack time
by dividing
slack
time by number of remaining operations
including the current one.
6.
Rush emergency: Emergency or Preferred Customers
first.
Assumptions
to Priority Rules
1.
The set of jobs is known, no
new jobs arrive after
processing begins and no jobs
are
canceled.
2.
Setup time is
deterministic
3.
Processing times are deterministic rather
than variables.
4.
There will be no interruptions in
processing such as machine breakdowns ,
accidents or
worker
illnesses.
Definitions
Job
Flow Time: The length of
time a job is in the shop at a
particular workstation or work
center.
Job
Lateness: This is the length of
time the job completion
date is expected to exceed the date
the
job
was due or promised to a customer.
189
Production
and Operations Management
MGT613
VU
Makespan:
This is the total time
needed to complete a group of jobs. It is
the length of time between
the
start of the first job in the
group and the completion of the last job
in the group.
Average
Number of Jobs: Jobs that
are considered in a shop are considered
to be work in process
inventory.
Mathematically
Average
Number of Jobs= Total Flow
Time / Makespan
Example
Determine
the sequence of jobs, average
time flow, average days
late and average number of jobs
at
the
work center, for each of
these rules
FCFS
SPT
DD
CR
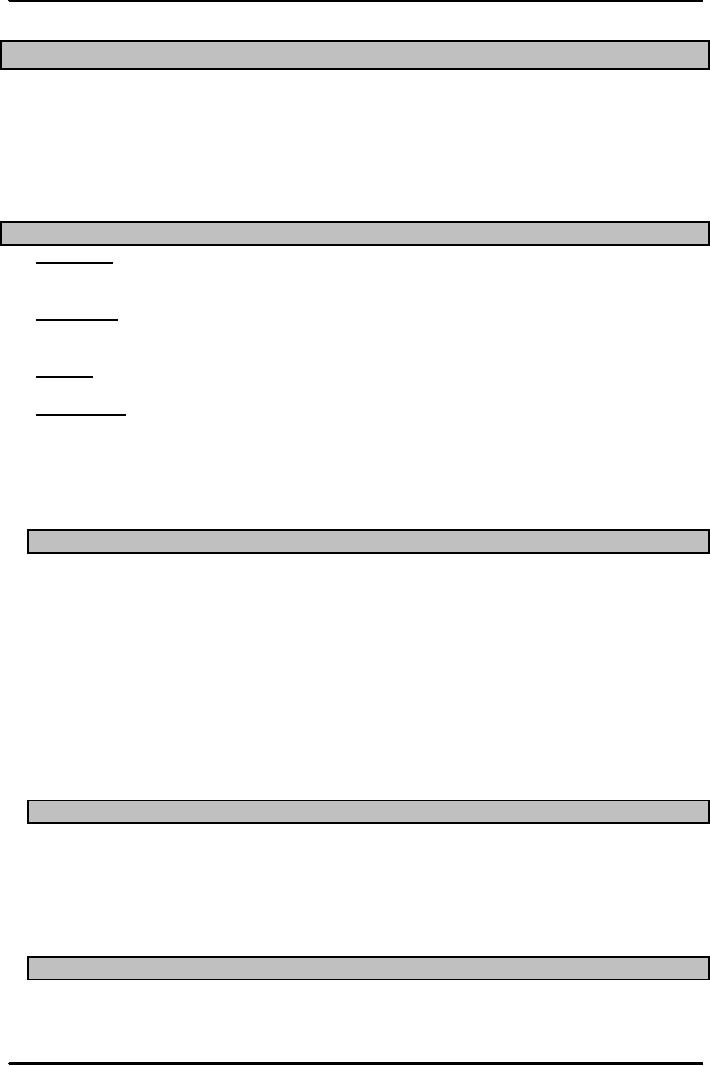
Example
Data
JOB
Processing
Time
Due
Date
A
2
7
B
8
16
C
4
4
D
10
17
E
5
15
F
12
18
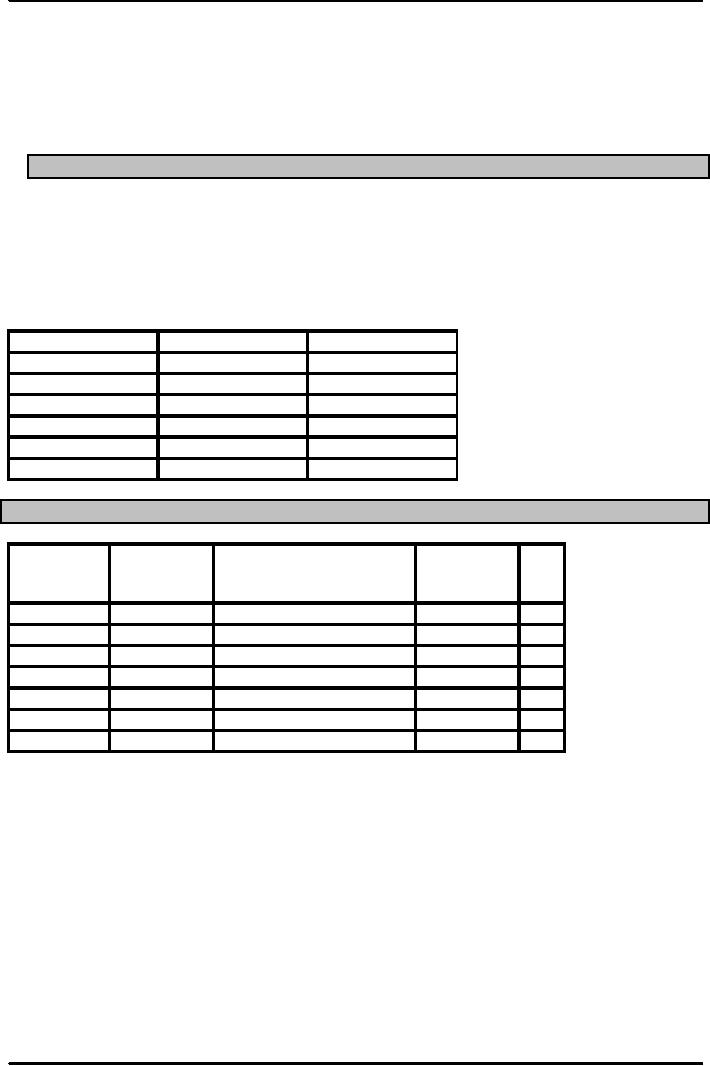
Part
A. FCFS
Assume
Jobs arrived in the following
order 1. A-B-C-D-E-F
Processing
JOB
Flow
Time ( cumulative
Due
Date (2)-
Sequences
Time
processing
time) (2)
(3)
(3)
(1)
A
2
2
7
0
B
8
10
16
0
C
4
14
4
10
D
10
24
17
7
E
5
29
15
14
F
12
41
18
22
41
120
54
Part
A. FCFS
Average
Flow time= Total Flow
Time/Number of Jobs=120/6=20 days
Average
Tardiness=54/6=9
The
makespan =41 days
Average
Number of Jobs at
workstation=
120/41=2.93
jobs per workstation
SPT,
the sequence is A-C-E-B-D-F
190
Production
and Operations Management
MGT613
VU
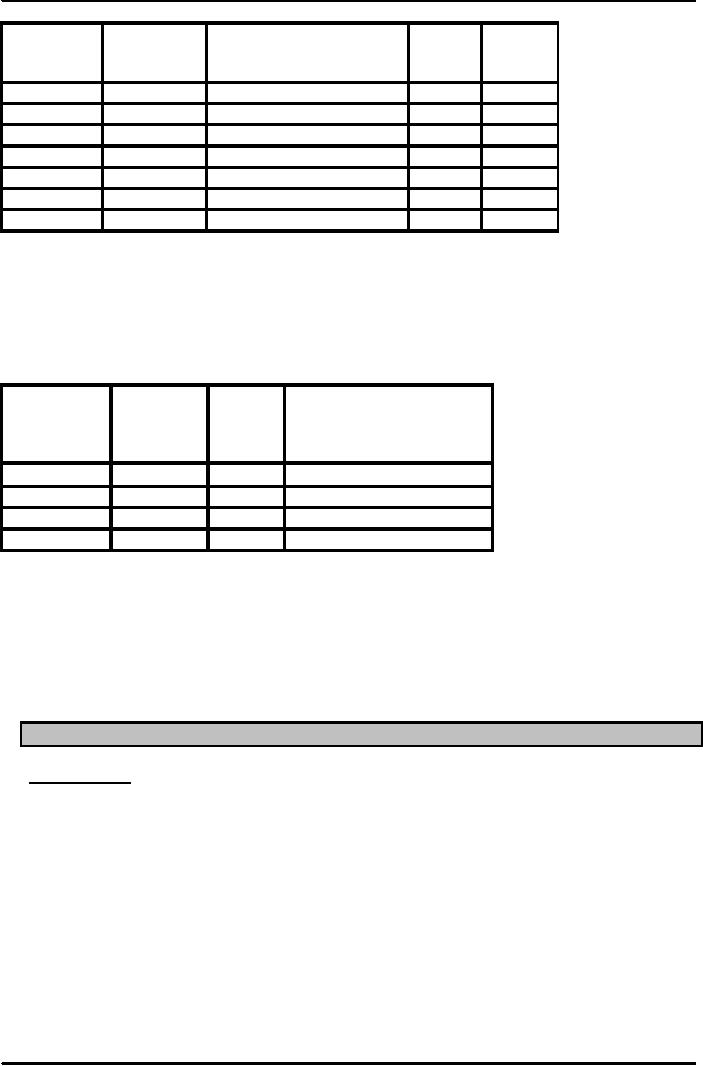
Part
B SPT rule
JOB
Processing
Flow
Time ( cumulative
Due
(2)-(3)
Sequences
Time
processing
time)
Date
(1)
(2)
(3)
A
2
2
7
0
C
4
6
4
2
E
5
11
15
0
B
8
19
16
3
D
10
29
17
12
F
12
41
18
23
41
108
40
Average
Flow time= Total Flow
Time/Number of Jobs=108/6=18 days
Average
Tardiness=40/6=6.67days
The
makespan =41 days
Average
Number of Jobs at
workstation=
108/41=2.63
jobs per workstation
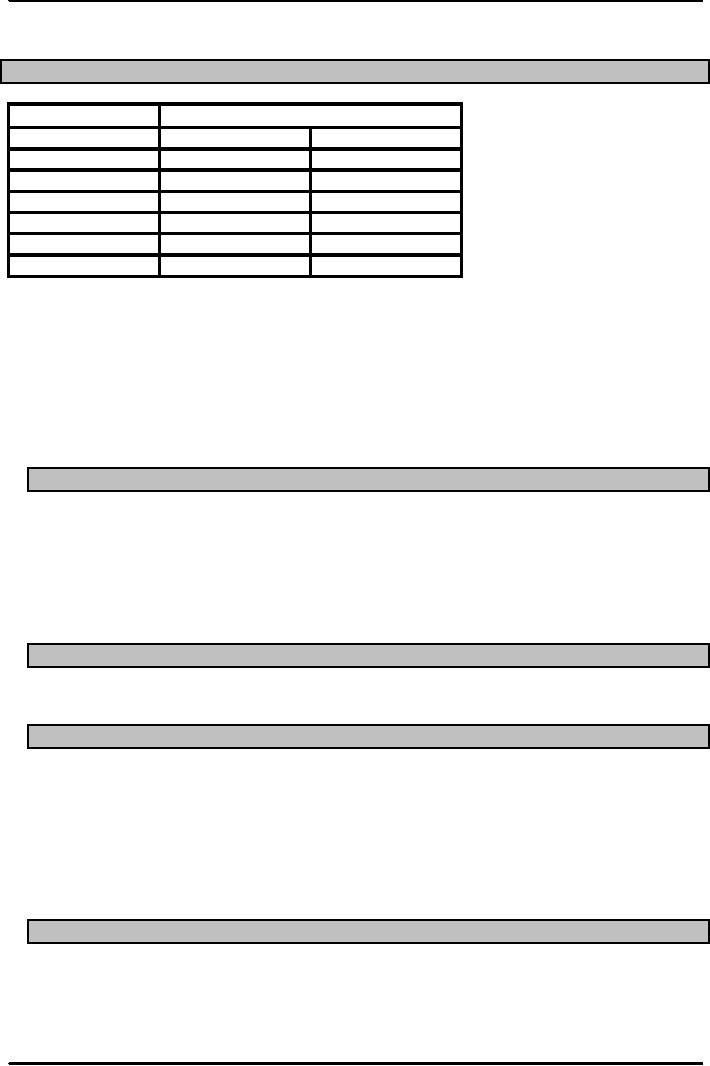
Summary
Part A,B,C and D
Average
Average Average Number of
Jobs of
JOB
Flow
Lateness
the Work Center
Sequences
Time
(Days)
Rule
(Days)
FCFS
20.00
9.00
2.93
SPT
18.00
6.67
2.63
DD
18.33
6.33
2.68
CR
26.67
14.17
3.9
Summary
Part A,B,C and D
1.
Generally Speaking FCFS and
CR rule seems to be the least
effective.
2.
CR is the worst in each aspect of
measurement.
3.
The primary limitation of
FCFS is that long jobs
will tend to delay other
jobs.
4.
However in scheduling of service systems,
the FCFS has the advantage of
simplicity,
inherent
fairness (first come first
served) but also due to non
availability of realistic
estimates
of processing times for individual
jobs.
Johnson's
Rule (Two Work Center
Sequencing)
Johnson's
Rule:
technique for minimizing
completion time for a group
of jobs to be processed on
two
machines or at two work
centers.
1.
Minimizes total idle
time
2.
Several conditions must be
satisfied
Johnson's
Rule Conditions
1.
Job
time must be known and
constant
2.
Job
times must be independent of
sequence
3.
Jobs
must follow same two-step
sequence
4.
Job
priorities cannot be used
5.
All
units must be completed at the first
work center before moving to
second
Johnson's
Rule Optimum Sequence
1.
List the jobs and their times at
each work center
191
Production
and Operations Management
MGT613
VU
2.
Select the job with the
shortest time
3.
Eliminate the job from
further consideration
4.
Repeat steps 2 and 3 until
all jobs have been
scheduled
Johnson's
Rule Example
PROCESSING
TIMES ( HOURS)
JOB
Work
Center 1
Work
Center2
A
5
5
B
4
3
C
8
9
D
2
7
E
6
8
F
12
15
1.
Select the job with shortest
processing time. In our case
it is Job D
2.
Eliminate the row of JOB D &
proceed further to select the
next job with
shortest
processing
time which is B in our case
and that too at work
center2
3.
Similarly sequencing other jobs at
work centers, we follow that
if there is tie of no of hours,
we
can sequence it at the beginning or the
end.
4.
Construct a chart to determine the throughput
time and idle times at the
work centers. We
have
5.
1st D,2nd E,3rd C,4th F,5th A and
6th B
Scheduling
Difficulties
1.
Variability in
a.
Setup times
b.
Processing times
c.
Interruptions
d.
Changes in the set of
jobs
2.
No method for identifying optimal
schedule
3.
Scheduling is not an exact
science
4.
Ongoing task for a
manager
Minimizing
Scheduling Difficulties
1.
Set realistic due
dates
2.
Focus on bottleneck operations
3.
Consider lot splitting of large
jobs
Scheduling
Service Operations
1.
Appointment systems
a.
Controls customer arrivals
for service
2.
Reservation systems
a.
Estimates demand for
service
3.
Scheduling the workforce
a.
Manages capacity for service
4.
Scheduling multiple
resources
a.
Coordinates use of more than one
resource
Cyclical
Scheduling
1.
Hospitals,
police/fire departments, restaurants,
supermarkets
2.
Rotating
schedules
3.
Set
a scheduling horizon
4.
Identify
the work pattern
5.
Develop
a basic employee
schedule
192
Production
and Operations Management
MGT613
VU
6.
Assign employees to the schedule
Service
Operation Problems
1.
Cannot store or inventory
services
2.
Customer service requests are
random
3.
Scheduling service involves
a.
Customers
b.
Workforce
c.
Equipment
Maintenance
Maintenance:
All activities that maintain
facilities and equipment in good
working order so that
a
system
can perform as
intended
Breakdown
maintenance: Reactive approach; dealing with
breakdowns or problems when they
occur
Preventive
maintenance: Proactive approach; reducing breakdowns
through a program of
lubrication,
adjustment, cleaning, inspection, and replacement of
worn parts
Maintenance
Reasons
Reasons
for keeping equipment
running
1.
Avoid production
disruptions
2.
Not add to production
costs
3.
Maintain high quality
4.
Avoid missed delivery
dates
Breakdown
Consequences
Some
of the Important consequences are:
1.
Production capacity is reduced :
Orders are delayed
2.
No production: Overhead continues
3.
Cost per unit increases:
Quality issues
4.
Product may be damaged
5.
Safety issues
a.
Injury to employees
b.
Injury to customers
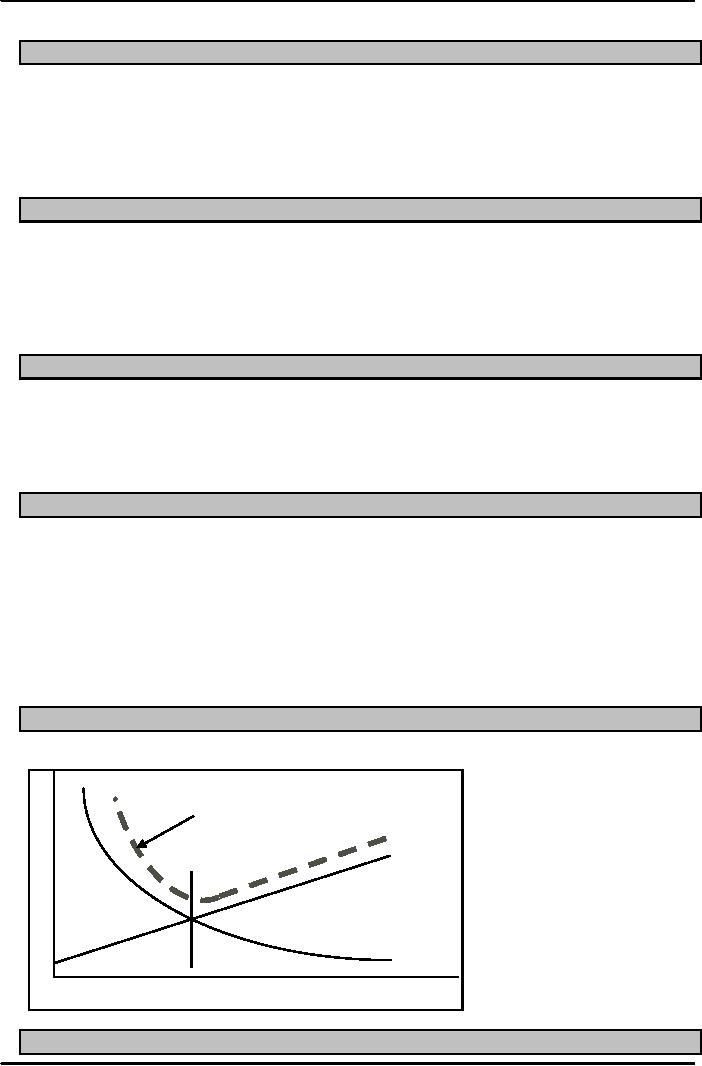
Total
Maintenance Cost
Total
Cost
Preventive
maintenance
cost
Breakdown
and
repair
cost
Optimum
Amount of
Preventive
Maintenance
Preventive
Maintenance
193
Production
and Operations Management
MGT613
VU
Preventive
maintenance:
goal is to reduce the incidence of
breakdowns or failures in the plant
or
equipment
to avoid the associated
costs
1.
Preventive maintenance is periodic
2.
Result of planned inspections
3.
According to calendar
4.
After predetermined number of
hours
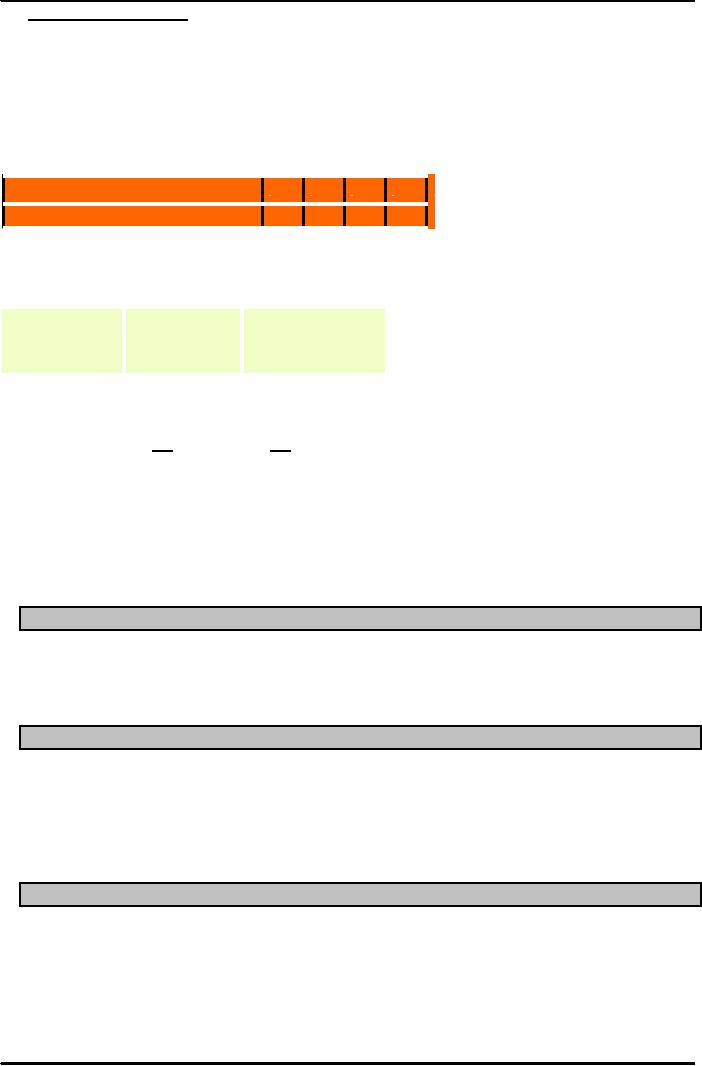
Example
1
Frequency
of breakdown
1
2
3
Number
of breakdowns
0
Frequency
of occurrence
.20
.30 .40 .10
If
the average cost of a breakdown is
Rs.10,000, and the cost of preventative
maintenance is
Rs.12,500
per month, should we use
preventive maintenance?
Example
1 Solution
Number
of
Frequency
Expected
Breakdowns
of
number
of
Occurrence
Breakdowns
0
.20
0
1
.30
.30
2
.40
.80
3
.10
.30
1.00
1.40
Expected
cost to repair = 1.4 breakdowns per
month X Rs.10,000
=
Rs.14,000
Preventive
maintenance = Rs.12,500.
PM
results in savings of Rs.1500 per
month
Predictive
Maintenance
Predictive
maintenance: An attempt to determine when best to
perform preventive maintenance
activities
Total
productive maintenance: JIT approach where
workers perform preventive maintenance on
the
machines
they operate
Breakdown
Programs
1.
Standby
or backup equipment that can
be quickly pressed into
service
2.
Inventories
of spare parts that can be
installed as needed
3.
Operators
who are able to perform
minor repairs
4.
Repair
people who are well
trained and readily available to diagnose
and correct problems
with
equipment
Replacement
1.
Trade-off
decisions
2.
Cost
of replacement vs. cost of continued
maintenance
3.
New
equipment with new features
vs. maintenance
4.
Installation
of new equipment may cause
disruptions
5.
Training
costs of employees on new
equipment
6.
Forecasts
for demand on equipment may
require new equipment
capacity
7.
When
is it time for
replacement?
194

Production
and Operations Management
MGT613
VU
Operations
Strategy
1.
Scheduling can hinder or
help the Operations Strategy.
2.
An on time delivery of a product or
service is only possible if the Operations Managers
is
able
to do effective scheduling.
3.
An ineffective scheduling would
result in inefficient use of
resources and possible
dissatisfied
customers.
4.
Scheduling as an Operations Strategy can
provide an organization a competitive
advantage
over
its competitors.
5.
Time based competition
depends on good
scheduling.
6.
Good design, superior quality and
other elements of a well run
organization are
meaningless
if
effective scheduling is absent
from Operations Management
Strategy.
7.
Scheduling is that bank
balance which may seem great
in numbers but if not
used
effectively
would not make any
sense.
Summary
Scheduling
involves timing and coordination of
operations. Scheduling is different for
high volume,
intermediate
volume and low volume.
Scheduling for job shops is
very complex, because of
variety
jobs
that need to be processed.
The two major problems in
Scheduling is the assigning of jobs to
the
machines
(work centers) and sequence of operations
at a machine.
Gantt
Load charts are used to
help managers visualize the
work load situation.
Scheduling
of service systems require appointment or
reservation systems, although
all systems are
not
amenable to this. When
multiple resources are
involved, the balancing can be
difficult.
Maintenance
Activities ensure that
sequence activities are
completed on time and as per
schedule.
Maintenance
adds to revenue and not to
costs.
195
Table of Contents:
- INTRODUCTION TO PRODUCTION AND OPERATIONS MANAGEMENT
- INTRODUCTION TO PRODUCTION AND OPERATIONS MANAGEMENT:Decision Making
- INTRODUCTION TO PRODUCTION AND OPERATIONS MANAGEMENT:Strategy
- INTRODUCTION TO PRODUCTION AND OPERATIONS MANAGEMENT:Service Delivery System
- INTRODUCTION TO PRODUCTION AND OPERATIONS MANAGEMENT:Productivity
- INTRODUCTION TO PRODUCTION AND OPERATIONS MANAGEMENT:The Decision Process
- INTRODUCTION TO PRODUCTION AND OPERATIONS MANAGEMENT:Demand Management
- Roadmap to the Lecture:Fundamental Types of Forecasts, Finer Classification of Forecasts
- Time Series Forecasts:Techniques for Averaging, Simple Moving Average Solution
- The formula for the moving average is:Exponential Smoothing Model, Common Nonlinear Trends
- The formula for the moving average is:Major factors in design strategy
- The formula for the moving average is:Standardization, Mass Customization
- The formula for the moving average is:DESIGN STRATEGIES
- The formula for the moving average is:Measuring Reliability, AVAILABILITY
- The formula for the moving average is:Learning Objectives, Capacity Planning
- The formula for the moving average is:Efficiency and Utilization, Evaluating Alternatives
- The formula for the moving average is:Evaluating Alternatives, Financial Analysis
- PROCESS SELECTION:Types of Operation, Intermittent Processing
- PROCESS SELECTION:Basic Layout Types, Advantages of Product Layout
- PROCESS SELECTION:Cellular Layouts, Facilities Layouts, Importance of Layout Decisions
- DESIGN OF WORK SYSTEMS:Job Design, Specialization, Methods Analysis
- LOCATION PLANNING AND ANALYSIS:MANAGING GLOBAL OPERATIONS, Regional Factors
- MANAGEMENT OF QUALITY:Dimensions of Quality, Examples of Service Quality
- SERVICE QUALITY:Moments of Truth, Perceived Service Quality, Service Gap Analysis
- TOTAL QUALITY MANAGEMENT:Determinants of Quality, Responsibility for Quality
- TQM QUALITY:Six Sigma Team, PROCESS IMPROVEMENT
- QUALITY CONTROL & QUALITY ASSURANCE:INSPECTION, Control Chart
- ACCEPTANCE SAMPLING:CHOOSING A PLAN, CONSUMERS AND PRODUCERS RISK
- AGGREGATE PLANNING:Demand and Capacity Options
- AGGREGATE PLANNING:Aggregate Planning Relationships, Master Scheduling
- INVENTORY MANAGEMENT:Objective of Inventory Control, Inventory Counting Systems
- INVENTORY MANAGEMENT:ABC Classification System, Cycle Counting
- INVENTORY MANAGEMENT:Economic Production Quantity Assumptions
- INVENTORY MANAGEMENT:Independent and Dependent Demand
- INVENTORY MANAGEMENT:Capacity Planning, Manufacturing Resource Planning
- JUST IN TIME PRODUCTION SYSTEMS:Organizational and Operational Strategies
- JUST IN TIME PRODUCTION SYSTEMS:Operational Benefits, Kanban Formula
- JUST IN TIME PRODUCTION SYSTEMS:Secondary Goals, Tiered Supplier Network
- SUPPLY CHAIN MANAGEMENT:Logistics, Distribution Requirements Planning
- SUPPLY CHAIN MANAGEMENT:Supply Chain Benefits and Drawbacks
- SCHEDULING:High-Volume Systems, Load Chart, Hungarian Method
- SEQUENCING:Assumptions to Priority Rules, Scheduling Service Operations
- PROJECT MANAGEMENT:Project Life Cycle, Work Breakdown Structure
- PROJECT MANAGEMENT:Computing Algorithm, Project Crashing, Risk Management
- Waiting Lines:Queuing Analysis, System Characteristics, Priority Model