 |
REAL VERSUS NOMINAL PRICES:SUPPLY AND DEMAND, The Demand Curve |
| << Economics: Another Perspective, Factors of Production |
| Changes in Market Equilibrium:Market for College Education >> |
Microeconomics
ECO402
VU
Lesson
3
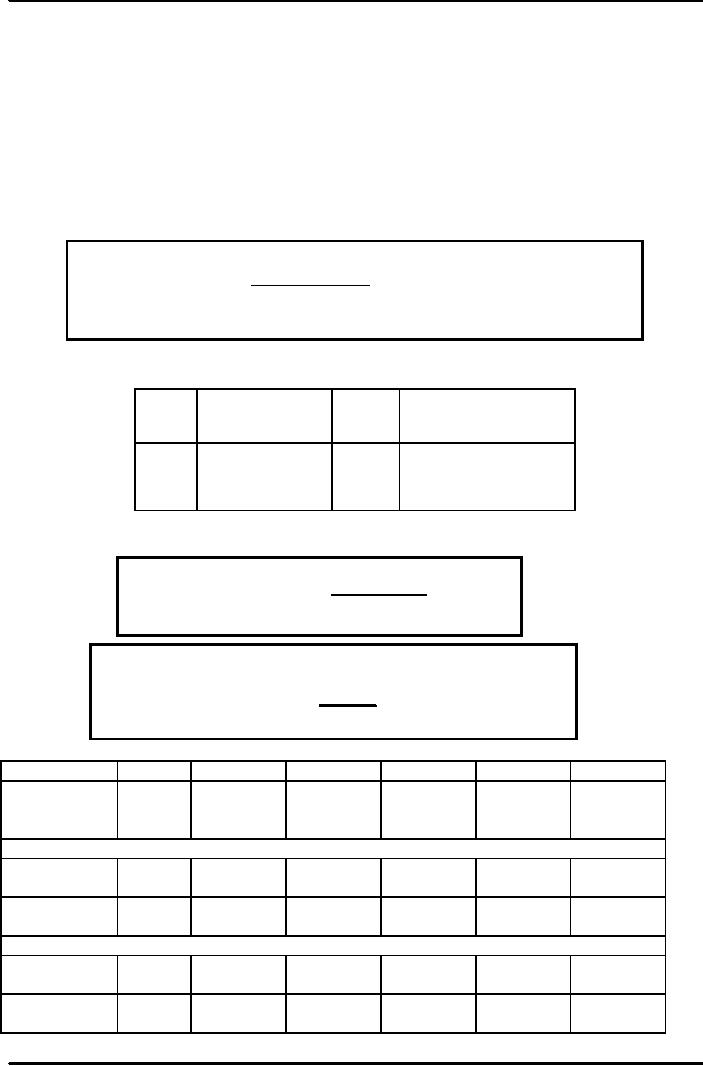
REAL
VERSUS NOMINAL
PRICES
Nominal
price is the absolute or
current dollar price of a
good or service when it is
sold.
Real
price is the price relative
to an aggregate measure of prices or
constant dollar
price.
The
Consumer Price Index (CPI)
is an aggregate measure. Real
prices are
emphasized
to permit the analysis of
relative prices.
Calculating
Real Prices
CPI
base
year
Real
Price =
x
Nominal Price current
year
CPI
current
year
Calculating
the Real Price of
Milk
Nominal
Price
Real
Price of Milk
Year
of
Milk
CPI
in
1970 dollars
1970
.40
38.8
.40=38.8/38.8x
.40
1980
.65
82.4
.31=38.8/82.4x
.65
1999
1.05
167.0
.24=38.8/167.0x
1.05
Calculating
Real Prices: An Example -
Eggs & College
38.8
1970
=
Real
Price of Eggs
x
1.04
163
1998
(1970 = 100)
Real
Price of
38.8
College
Education =
x
$19,213 =
$4,573
163.0
1998
(1970 = 100)
1970
1975
1980
1985
1990
1998
Consumer
Price
Index
38.3
53.8
82.4
107.6
130.7
163.0
(1983
= 100)
Nominal
Prices ($)
Grade
A
0.61
0.77
0.84
0.80
0.98
1.04
Large
Eggs
College
2530
3403
4912
8156
12800
19213
Education
Real
Prices ($1970)
Grade
A
0.61
0.56
0.40
0.29
0.30
0.25
Large
Eggs
College
2530
2454
2313
2941
3800
4573
Education
5
Microeconomics
ECO402
VU
SUPPLY
AND DEMAND
The
Supply Curve
Price
($
The
Supply
S
per
unit)
The
supply curve shows how
much of a
Curve
Graphically
good
producers are willing to
sell at a
given
price, holding constant
other
factors
that might affect quantity
supplied
This
price-quantity relationship can
be
P2
shown
by the equation:
The
supply curve
slopes
upward
demonstrating
P1
=
Q
S(P
)
Q
that
at higher
s
irms
will increase
output.
Q2
Quantit
Q1
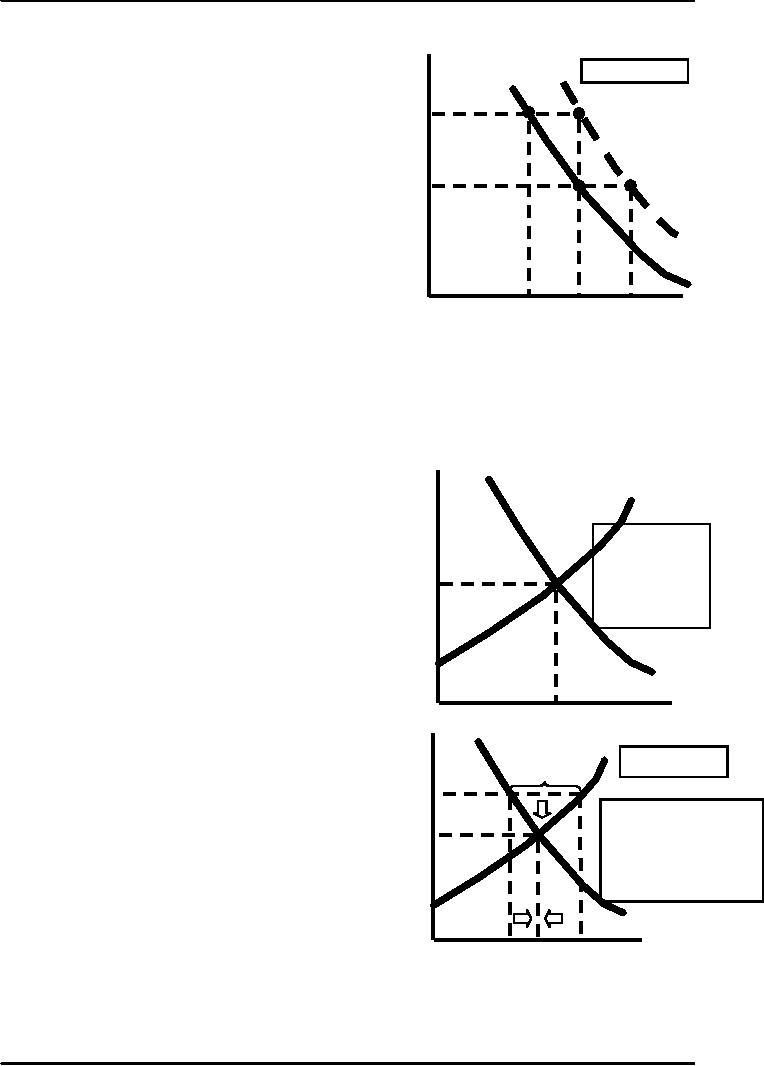
P
S'
S
Change
in Supply
Non-price
Determining Variables of
Supply
Costs of
Production
·
Labor
·
Capital
·
Raw
Materials
P1
The
cost of raw materials
falls
P2
At
P1, produce Q2
At
P2, produce Q1
Supply
curve shifts right to
S'
More
produced at any price on S'
than on S
Q0
Q1
Q
Supply
- A Review
Q2
Supply is
determined by non-price
supply-determining variables as such as
the cost of
labor,
capital, and raw
materials.
Changes in
supply are shown by shifting
the entire supply
curve.
Changes in
quantity supplied are shown
by movements along the
supply curve and
are
caused
by a change in the price of
the product.
The
Demand Curve
Price
($
The
demand curve shows how
much of a good
The
demand curve slopes
per
consumers
are willing to buy as the
price per unit
downward
demonstrating that
unit)
consumers
are willing to buy
changes
holding non-price factors
constant.
more
at a lower price as
product
becomes relatively
This
price-quantity relationship can be
shown by the
cheaper
and the consumer's
equation:
real
income increases
Q
D =
Q
D (P)
D
Quantity
6
Microeconomics
ECO402
VU
P
Non-price
Determining Variables of
Change
in Demand
D'
Demand
D
Income
P2
Consumer
Tastes
Price of
Related Goods
·
Substitutes
·
Complements
P1
Income
Increases
At
P1,
produce Q2
At
P2,
produce Q1
Demand
Curve shifts right
More
purchased at any price on
D'
than
on D
Q0
Q1
Q2
Q
Demand
- A Review
Demand is
determined by non-price
demand-determining variables, such
as,
income,
price of related goods, and
tastes.
Changes in
demand are shown by shifting
the entire demand
curve.
Changes in
quantity demanded are shown
by movements along the
demand
curve.
Price
The
Market Mechanism
($
per
S
Characteristics
of the equilibrium or
market
unit)
clearing
price:
QD =
QS
The
curves intersect
at
equilibrium, or
No
shortage
market
clearing,
No
excess supply
price.
At P0 the
P0
quantity
supplied is
No
pressure on the price to
change
equal
to the quantity
demanded
at Q0 .
D
Q0
Quantity
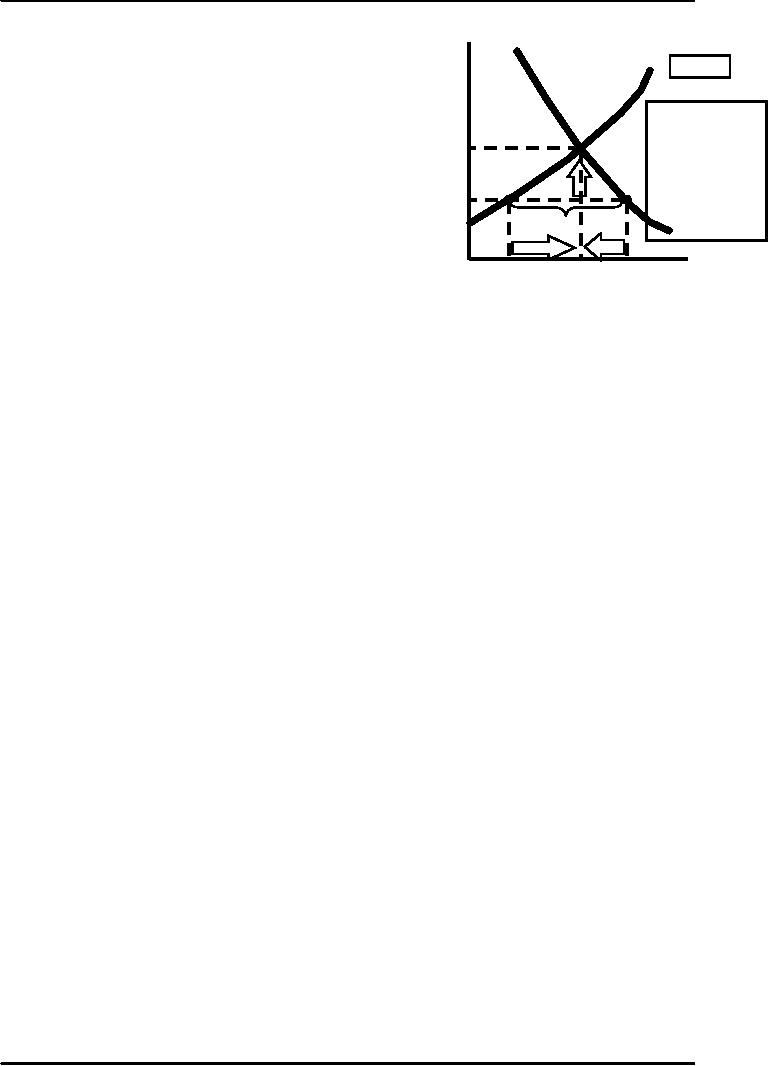
Price
The
market price is above
equilibrium
($
per
S
A
Surplus
There is
excess supply
unit)
Surplus
Producers
lower prices
P1
Quantity
demanded increases
and
Assume
the price is P1,then:
quantity
supplied decreases
1)
Qs : Q1 > Qd : Q2
P2
2)
Excess supply is
Q1:Q2.
The
market continues to adjust
until
3)
Producers lower
price.
the
equilibrium price is
reached.
4)
Quantity supplied
decreases
and
quantity demanded
increases.
5)
Equilibrium at P2Q3
D
Q2
Q1
Q3
Quantity
7
Microeconomics
ECO402
VU
The
market price is below
equilibrium:
Price
S
There is a
shortage
($
per
Shortage
unit)
Producers
raise prices
Quantity
demanded decreases
and
Assume
the price is
quantity
supplied increases
P2,:
The
market continues to adjust
until the
1)
Qd :
Q2 > Qs
: Q1
P3
2)
Shortage is Q1:Q2.
new
equilibrium price is
reached.
3)
Producers raise
price.
4)
Quantity supplied
increases
and quantity
P2
demanded
decreases.
5)
Equilibrium at P3,
Q3
Shortage
D
Q1
Q3
Q2
Quantity
Market
Mechanism Summary
1)
Supply and demand interacts
to determine the market-clearing
price.
2)
When not in equilibrium, the
market will adjust to
alleviate a shortage or
surplus
and return the market to
equilibrium.
3)
Markets must be competitive
for the mechanism to be
efficient.
8
Table of Contents:
- ECONOMICS:Themes of Microeconomics, Theories and Models
- Economics: Another Perspective, Factors of Production
- REAL VERSUS NOMINAL PRICES:SUPPLY AND DEMAND, The Demand Curve
- Changes in Market Equilibrium:Market for College Education
- Elasticities of supply and demand:The Demand for Gasoline
- Consumer Behavior:Consumer Preferences, Indifference curves
- CONSUMER PREFERENCES:Budget Constraints, Consumer Choice
- Note it is repeated:Consumer Preferences, Revealed Preferences
- MARGINAL UTILITY AND CONSUMER CHOICE:COST-OF-LIVING INDEXES
- Review of Consumer Equilibrium:INDIVIDUAL DEMAND, An Inferior Good
- Income & Substitution Effects:Determining the Market Demand Curve
- The Aggregate Demand For Wheat:NETWORK EXTERNALITIES
- Describing Risk:Unequal Probability Outcomes
- PREFERENCES TOWARD RISK:Risk Premium, Indifference Curve
- PREFERENCES TOWARD RISK:Reducing Risk, The Demand for Risky Assets
- The Technology of Production:Production Function for Food
- Production with Two Variable Inputs:Returns to Scale
- Measuring Cost: Which Costs Matter?:Cost in the Short Run
- A Firms Short-Run Costs ($):The Effect of Effluent Fees on Firms Input Choices
- Cost in the Long Run:Long-Run Cost with Economies & Diseconomies of Scale
- Production with Two Outputs--Economies of Scope:Cubic Cost Function
- Perfectly Competitive Markets:Choosing Output in Short Run
- A Competitive Firm Incurring Losses:Industry Supply in Short Run
- Elasticity of Market Supply:Producer Surplus for a Market
- Elasticity of Market Supply:Long-Run Competitive Equilibrium
- Elasticity of Market Supply:The Industrys Long-Run Supply Curve
- Elasticity of Market Supply:Welfare loss if price is held below market-clearing level
- Price Supports:Supply Restrictions, Import Quotas and Tariffs
- The Sugar Quota:The Impact of a Tax or Subsidy, Subsidy
- Perfect Competition:Total, Marginal, and Average Revenue
- Perfect Competition:Effect of Excise Tax on Monopolist
- Monopoly:Elasticity of Demand and Price Markup, Sources of Monopoly Power
- The Social Costs of Monopoly Power:Price Regulation, Monopsony
- Monopsony Power:Pricing With Market Power, Capturing Consumer Surplus
- Monopsony Power:THE ECONOMICS OF COUPONS AND REBATES
- Airline Fares:Elasticities of Demand for Air Travel, The Two-Part Tariff
- Bundling:Consumption Decisions When Products are Bundled
- Bundling:Mixed Versus Pure Bundling, Effects of Advertising
- MONOPOLISTIC COMPETITION:Monopolistic Competition in the Market for Colas and Coffee
- OLIGOPOLY:Duopoly Example, Price Competition
- Competition Versus Collusion:The Prisoners Dilemma, Implications of the Prisoners
- COMPETITIVE FACTOR MARKETS:Marginal Revenue Product
- Competitive Factor Markets:The Demand for Jet Fuel
- Equilibrium in a Competitive Factor Market:Labor Market Equilibrium
- Factor Markets with Monopoly Power:Monopoly Power of Sellers of Labor