 |

Financial
Management MGT201
VU
Lesson
22
PORTFOLIO
RISK ANALYSIS AND EFFICIENT
PORTFOLIO MAPS
Learning
Objectives:
After
going through this lecture,
you would be able to have an
understanding of the following
topics
·
Portfolio
Risk Analysis & Efficient
Portfolio Maps
Before
starting the new concepts we
should recap what we have
studied in the previous
lecture.
Recap:
Portfolio
is a Collection of Investments in different
Stocks, Bonds, other Securities or a mix
of
all.
Its objective is to invest in
Different Un-Correlated Stocks in
order to minimize overall
Risk &
Maximize
Portfolio Return. It is mentioned
that individuals and
companies maintain the portfolio
in
order
to reduce to reduce the
risk
There
are 2 Types of Stock
Risk
Total
Stock Risk = Diversifiable + Market
Risk
Diversification
means expanding the number of investments
which cover different kinds
of
stocks.
We can reduce the risk as random
events in one industry can
be off set by the random effects
in
the
other industry. This way
you can reduce the company
pacific or unique risk. The
market risk arises
because
of micro economic or large scale factors
such as market interest rate, inflation
etc. These factors
have
virtually identical effect on the
share prices. For example, in
event of a war stick market
go down
in
value which means almost
every share went
down.7
Stocks
are a good number for
diversification. 40
Stocks
are enough for Minimizing
Total Risk
Calculating
Expected 2-Stock Portfolio Return &
Risk
Expected
Portfolio Return = rP * = xA rA + xB
rB
Portfolio
Risk is generally not a
simple weighted average.
Up
to this point we only look
at the portfolio which has
only two stocks.
Interpreting
2-Stock Portfolio Risk
Formula:
=
√
XA2
σ
A 2
+XB2
σ
B 2
+ 2
(XA
XB
σ A
σ
B
AB)
is
coefficient of correlation which
states that how muck the
investments are correlated.
Here,
The
risk of investing in any one
share can be reduced if we
invest in other shares also.
There have been
several
experiment studies that show
that if you invest in
approximately 40 different
uncorrelated
different
shares of different companies
then you can entirely
eliminate the company pacific portion
of
the
risk. Even if you can
not diversify across 40
different companies but if
you diversify just across
7
different
shares from different
companies then you can
still you can reduce
most of the diversifiable
risk.
No
matter what we do we can not
eliminate the market risk
that market risk become the
minimum risk
we
have to live with in our
portfolio. The important
thing then to remember is
that how this risk
will
effected
when we talk about portfolio
of two stocks or more. The
Correlation coefficient needs to
be
understood
in order to understand the risk and
return.
Correlation
Coefficient (
AB
or "Ro"):
Risk
of a Portfolio of only 2 Stocks A & B
depends on the Correlation between those
2 stocks.
The
value of Ro is between -1.0 and
+1.0
If
Ro = 0 then Investments are Uncorrelated
& Risk Formula simplifies to
Weighted Average
Formula.
If
Ro = + 1.0 then Investments are
Perfectly Positively Correlated and
this means that
Diversification
does not reduce
Risk.
If
Ro
= - 1.0, it
means that Investments are
Perfectly Negatively Correlated and the
Returns (or Prices
or
Values) of the 2 Investments move in
Exactly Opposite directions. In this
Ideal Case, All Risk can
be
diversified
away. For example, if the
price of one stock increases by
50% then the price of another
stock
goes
down by 50%.
In
Reality, Overall Ro for most
Stock Markets is about Ro = +
0.6.it
is very rough rule of thumb.
It
means
that correlations are not
completely perfect and you
should remember that if the
correlation
coefficient
is +1.0 then it is not possible to
reduce the diversifible
risk.
This
means that increasing the number of Investments in the
Portfolio can reduce some
amount of risk
but
not all risk
94

Financial
Management MGT201
VU
Portfolio
Risk - Example
Recap
Complete
2-Stock Investment Portfolio
Data:
Value
(Rs) Exp Return (%)
Risk (Std Dev)
Stock
A
30
20
20%
Stock
B
70
10
5%
Total
Value = 100
Correlation
Coeff Ro = + 0.6
2-Stock
Portfolio Risk
Calculation:
=
√
XA2
σ
A 2
+XB2
σ
B 2
+ 2
(XA
XB
σ A
σ
B
AB)
=
{0.0036 + 0.001225 + 0.00252}
0.5
=
0.0857= 8.57%
·
2-Stock Portfolio Return
Calculation:
rP* = x
A
r
A
+ x
B
r
B
= 6 + 7 =
13%
Interpretation
of Result:
The
Portfolio Risk for our
Basket of 2 Investments is
+8.57
% (if
Ro = + 0.6). What does
this
mean?
Bell
Curve Assumption: If we
assume a Normal Probability
Distribution, then there is a
68.26%
chance
that our future Portfolio
Return will be somewhere between
(rP*- σ
)
and (rP*+ σ
)
i.e.
between
(13% -8.57%) and (13%
+8.57%) or between +4.43% and
+21.57%
Portfolio
Risk lies between the Individual Risks of
the 2 Investments i.e
σ
Stock
B < σ
P
<
σ
Stock
A or 5% < 8.57% < 20% (if
Ro = +0.6)
You
can also come up with more
accurate outcome about the actual value
of the return on the portfolio
after
1 year if you take a larger
range for the standard
deviation. So, if you are
taking about the range
from
-2 sigma to +2 sigma towards then there
is likelihood that actual rate of return
of the portfolio is
somewhere
in between the two standard
deviation.
Note:
If Ro = -
0.6 (Negative Correlation)
then Portfolio Risk = + 4.8%
which is lower than
both
Individual
Investments!!
Now,
we consider the case of negatively
correlated investments.
Negatively
Correlated Investments
2-Stock
Investment Portfolio
Data:
Exp
Indiv Return (ri)
Indiv Risk (Std
Devi
)
Stock
A 20%
20%
Stock
B
10%
5%
Correlation
Coeff Ro = - 0.6
Portfolio
Risk & Return Table (for
Different Portfolio
Mixes):
Fraction
of Stock A
Portfolio
Risk Exp Portfolio Return
(rP*)
100%
20%
20%
80%
15%
18% = 0.8(20) +
0.2(10)
50%
9%
15%
= 0.5(20) + 0.5(10)
30%
4.8%
13%
15%
3.4%
11.5%
0%(i.e.
100% Stock B) 5%
10%
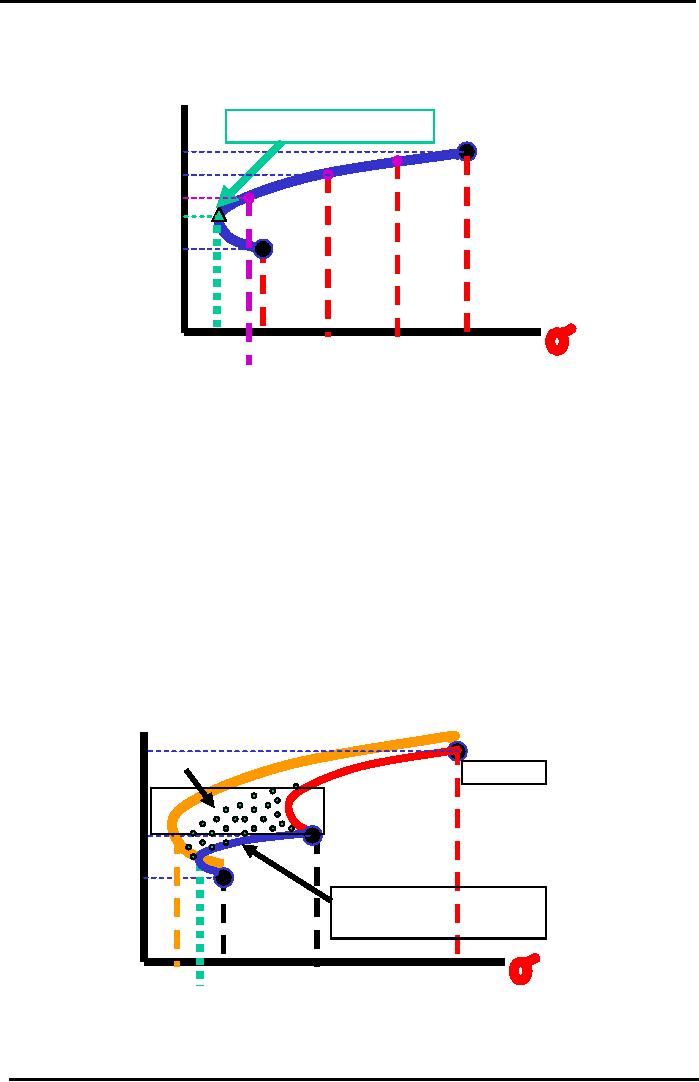
Efficient
Portfolio Map
95
Financial
Management MGT201
VU
Efficient
Portfolio Map
Shows
All Combinations of 2-Stock
Portfolio
Negative
Correlation (Ro =
-0.6)
rP*
Point
of Minimum
Portfolio
20%
Risk
Stock
A
Return
(100%
A &
15%
80%A
50%A
0%
B)
13%
30%A
11.5%
15%A
10%
Stock
B
(0%
A &
100%
B)
3.4%
5%
20%
9%
15%
P
Portfolio
Risk
4.8%
Efficient
Portfolio Interpretation
Efficient
Portfolio Map for 2-Stock
Portfolio shows all possible
Efficient Combinations
(Mixes)
of
stocks.
Efficient
Portfolios:
Efficient
Portfolios are those whose
Risk & Return values match the
ones computed using
Theoretical
Probability Formulas. The Incremental
Risk Contribution of a New
Stock to a Fully
Diversified
Portfolio of 40 Un-Correlated Stocks
will be the Market Risk
Component of the New
Stock
only.
The Diversifiable Risk of the
New Stock would be entirely
offset by random movements in the
other
40 stocks. Adding a New
Stock to the existing Portfolio
will create more Efficient
Portfolio
Curves.
The New Stock will
contribute its own
Incremental Risk and Return to the
Portfolio.
rP
* = xA rA + xB rB +
xC
rC (3
Stocks)
Efficient
Portfolio Maps
3-Stock
Portfolio
Negative
Correlation
rP*
Efficient
Frontier for
Portfolio
30%
3-Stock
Portfolio
Stock
C
Return
20%
Stock
A
10%
Stock
B
Old
Efficient Frontier
for
2-Stock
Portfolio of A & B
40%
2.5%
5%
20%
P
Portfolio
Risk
3.4%
96

Financial
Management MGT201
VU
Now,
if we add another stock in the portfolio we can
take a look
3-Stock
Portfolio Risk
Formula
3x3
Matrix Approach
Stock
A
Stock
B
Stock
C
XA2
2
Stock
XA
XB
XA
XC
A
A
B
AB
A
C
AC
A
XB2
2
Stock
XB
XA
XB
XC
B
A
BA
B
B
C
BC
B
XC2
2
Stock
XC
XA
XC
XB
C
A
CA
C
B
CB
C
C
To
compute the Portfolio
Variance for a
3-Stock Portfolio, just add up
all the terms in
every
box.
To compute the Portfolio Risk (Standard
Deviation), simply take the
Square Root of the
Variance.
You
can extend this Matrix
Approach to calculate the Risk
for a Portfolio consisting of
any
number
of stocks.
Terms
in Boxes on Diagonal (Top Left to
Bottom Right) are called
"VARIANCE"
terms
associated
with
individual magnitude of risk
for each stock.
Terms
in all other (or
NON-DIAGONAL) Boxes are called
"COVARIANCE"
terms
which account for
affect
of one stock's movement on another stock's
movement.
97
Table of Contents:
- INTRODUCTION TO FINANCIAL MANAGEMENT:Corporate Financing & Capital Structure,
- OBJECTIVES OF FINANCIAL MANAGEMENT, FINANCIAL ASSETS AND FINANCIAL MARKETS:Real Assets, Bond
- ANALYSIS OF FINANCIAL STATEMENTS:Basic Financial Statements, Profit & Loss account or Income Statement
- TIME VALUE OF MONEY:Discounting & Net Present Value (NPV), Interest Theory
- FINANCIAL FORECASTING AND FINANCIAL PLANNING:Planning Documents, Drawback of Percent of Sales Method
- PRESENT VALUE AND DISCOUNTING:Interest Rates for Discounting Calculations
- DISCOUNTING CASH FLOW ANALYSIS, ANNUITIES AND PERPETUITIES:Multiple Compounding
- CAPITAL BUDGETING AND CAPITAL BUDGETING TECHNIQUES:Techniques of capital budgeting, Pay back period
- NET PRESENT VALUE (NPV) AND INTERNAL RATE OF RETURN (IRR):RANKING TWO DIFFERENT INVESTMENTS
- PROJECT CASH FLOWS, PROJECT TIMING, COMPARING PROJECTS, AND MODIFIED INTERNAL RATE OF RETURN (MIRR)
- SOME SPECIAL AREAS OF CAPITAL BUDGETING:SOME SPECIAL AREAS OF CAPITAL BUDGETING, SOME SPECIAL AREAS OF CAPITAL BUDGETING
- CAPITAL RATIONING AND INTERPRETATION OF IRR AND NPV WITH LIMITED CAPITAL.:Types of Problems in Capital Rationing
- BONDS AND CLASSIFICATION OF BONDS:Textile Weaving Factory Case Study, Characteristics of bonds, Convertible Bonds
- BONDS VALUATION:Long Bond - Risk Theory, Bond Portfolio Theory, Interest Rate Tradeoff
- BONDS VALUATION AND YIELD ON BONDS:Present Value formula for the bond
- INTRODUCTION TO STOCKS AND STOCK VALUATION:Share Concept, Finite Investment
- COMMON STOCK PRICING AND DIVIDEND GROWTH MODELS:Preferred Stock, Perpetual Investment
- COMMON STOCKS RATE OF RETURN AND EPS PRICING MODEL:Earnings per Share (EPS) Pricing Model
- INTRODUCTION TO RISK, RISK AND RETURN FOR A SINGLE STOCK INVESTMENT:Diversifiable Risk, Diversification
- RISK FOR A SINGLE STOCK INVESTMENT, PROBABILITY GRAPHS AND COEFFICIENT OF VARIATION
- 2- STOCK PORTFOLIO THEORY, RISK AND EXPECTED RETURN:Diversification, Definition of Terms
- PORTFOLIO RISK ANALYSIS AND EFFICIENT PORTFOLIO MAPS
- EFFICIENT PORTFOLIOS, MARKET RISK AND CAPITAL MARKET LINE (CML):Market Risk & Portfolio Theory
- STOCK BETA, PORTFOLIO BETA AND INTRODUCTION TO SECURITY MARKET LINE:MARKET, Calculating Portfolio Beta
- STOCK BETAS &RISK, SML& RETURN AND STOCK PRICES IN EFFICIENT MARKS:Interpretation of Result
- SML GRAPH AND CAPITAL ASSET PRICING MODEL:NPV Calculations & Capital Budgeting
- RISK AND PORTFOLIO THEORY, CAPM, CRITICISM OF CAPM AND APPLICATION OF RISK THEORY:Think Out of the Box
- INTRODUCTION TO DEBT, EFFICIENT MARKETS AND COST OF CAPITAL:Real Assets Markets, Debt vs. Equity
- WEIGHTED AVERAGE COST OF CAPITAL (WACC):Summary of Formulas
- BUSINESS RISK FACED BY FIRM, OPERATING LEVERAGE, BREAK EVEN POINT& RETURN ON EQUITY
- OPERATING LEVERAGE, FINANCIAL LEVERAGE, ROE, BREAK EVEN POINT AND BUSINESS RISK
- FINANCIAL LEVERAGE AND CAPITAL STRUCTURE:Capital Structure Theory
- MODIFICATIONS IN MILLAR MODIGLIANI CAPITAL STRUCTURE THEORY:Modified MM - With Bankruptcy Cost
- APPLICATION OF MILLER MODIGLIANI AND OTHER CAPITAL STRUCTURE THEORIES:Problem of the theory
- NET INCOME AND TAX SHIELD APPROACHES TO WACC:Traditionalists -Real Markets Example
- MANAGEMENT OF CAPITAL STRUCTURE:Practical Capital Structure Management
- DIVIDEND PAYOUT:Other Factors Affecting Dividend Policy, Residual Dividend Model
- APPLICATION OF RESIDUAL DIVIDEND MODEL:Dividend Payout Procedure, Dividend Schemes for Optimizing Share Price
- WORKING CAPITAL MANAGEMENT:Impact of working capital on Firm Value, Monthly Cash Budget
- CASH MANAGEMENT AND WORKING CAPITAL FINANCING:Inventory Management, Accounts Receivables Management:
- SHORT TERM FINANCING, LONG TERM FINANCING AND LEASE FINANCING:
- LEASE FINANCING AND TYPES OF LEASE FINANCING:Sale & Lease-Back, Lease Analyses & Calculations
- MERGERS AND ACQUISITIONS:Leveraged Buy-Outs (LBOs), Mergers - Good or Bad?
- INTERNATIONAL FINANCE (MULTINATIONAL FINANCE):Major Issues Faced by Multinationals
- FINAL REVIEW OF ENTIRE COURSE ON FINANCIAL MANAGEMENT:Financial Statements and Ratios