 |
Competition Versus Collusion:The Prisoners Dilemma, Implications of the Prisoners |
| << OLIGOPOLY:Duopoly Example, Price Competition |
| COMPETITIVE FACTOR MARKETS:Marginal Revenue Product >> |

Microeconomics
ECO402
VU
Lesson
41
Competition
Versus Collusion:
The
Prisoners' Dilemma
Why
wouldn't each firm set
the collusion price
independently and earn the
higher profits that
occur
with explicit
collusion?
Assume:
FC
= $ 20
and VC =
$
0
Firm
1' s Demand : Q
= 12 - 2
P1 +
P2
Firm
2' s Demand : Q
= 12 - 2
P2 +
P1
= $
12
:
P
= $4
Nash
Equilibriu
m
= $
16
P
= $6
:
Collusion
Possible
Pricing Outcomes:
= $16
Firm
1 : P
= $6
Firm
2 : P
= $6
P
= $6
P
= $4
2
=
P2Q2 -
20
=
(4)[12
-
(2)(4)
+
6]
- 20
=
$20
1
=
P1Q1 -
20
=
(6)[12
-
(2)(6)
+
4]
- 20
=
$4
Payoff
Matrix for Pricing
Game
Firm
2
Charge
$4
Charge
$6
Charge
$4
$20,
$12,
Firm
1
Charge
$6
$4,
$16,
These
two firms are playing a
non co-operative
game.
Each firm
independently does the best
it can taking its competitor
into account.
Question
Why will
both firms both choose $4
when $6 will yield higher
profits?
An
example in game theory,
called the Prisoners'
Dilemma, illustrates the
problem
oligopolistic
firms face.
187

Microeconomics
ECO402
VU
Scenario
Two prisoners
have been accused of
collaborating in a crime.
They are in
separate jail cells and
cannot communicate.
Each has
been asked to confess to the
crime.
Payoff
Matrix for Prisoners'
Dilemma
Payoff
Matrix for Pricing
Game
Firm
2
Charge
$4
Charge
$6
Charge
$4
$20,
$12,
Firm
1
Charge
$6
$4,
$16,
Conclusions:
Oligipolistic Markets
1)
Collusion will lead to
greater profits
2)
Explicit and implicit
collusion is possible
3)
Once collusion exists, the
profit motive to break and
lower price is
significant
Implications
of the Prisoners'
Dilemma
for Oligipolistic
Pricing
Observations
of Oligopoly Behavior
1)
In some oligopoly markets,
pricing behavior in time can
create a
predictable
pricing environment and
implied collusion may
occur.
Observations
of Oligopoly Behavior
2)
In other oligopoly markets,
the firms are very
aggressive and collusion is
not
possible.
·
Firms are
reluctant to change price
because of the likely
response of their
competitors.
·
In this
case prices tend to be
relatively rigid.
188
Microeconomics
ECO402
VU
·
·
The
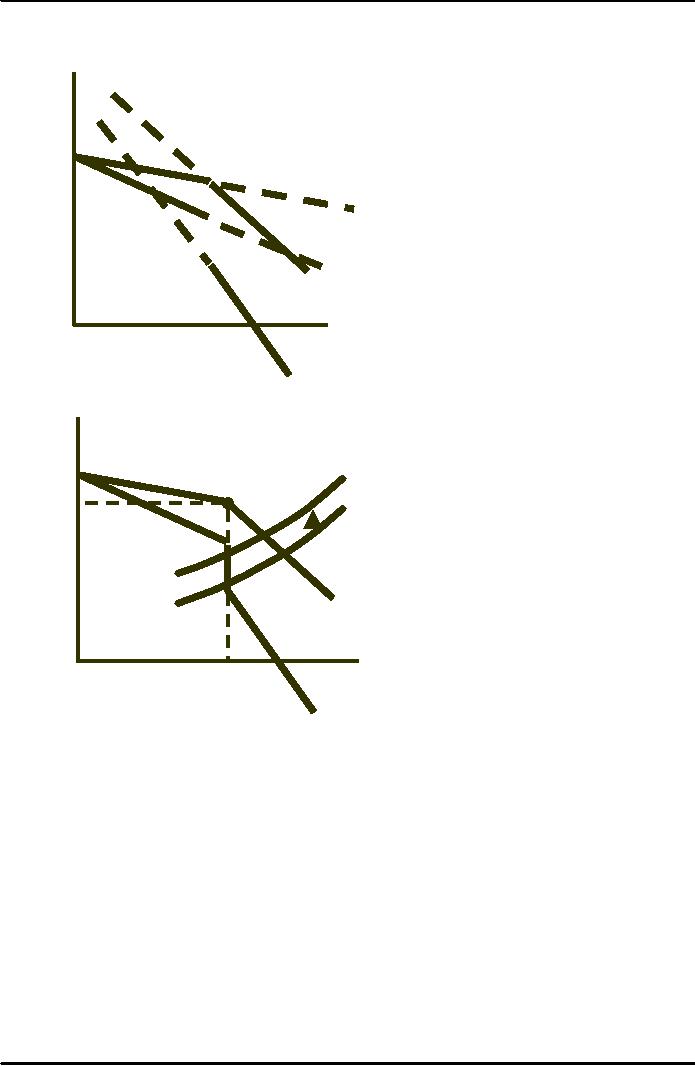
Kinked Demand Curve
If
the producer raises price
the
$/Q
competitors
will not and
the
demand
will be elastic.
If
the producer lowers price
the
competitors
will follow and
the
demand
will be inelastic.
D
Quantity
MR
So
long as marginal cost is in
the
$/Q
vertical
region of the
marginal
revenue
curve, price and
output
MC'
will
remain constant.
P*
MC
D
Quantity
Q*
MR
PRICE
SIGNALING & PRICE
LEADERSHIP
Price
Signaling
·
Implicit
collusion in which a firm
announces a price increase in
the hope that
other
firms
will follow suit
Price
Leadership
·
Pattern of
pricing in which one firm
regularly announces price
changes that other
firms
then match
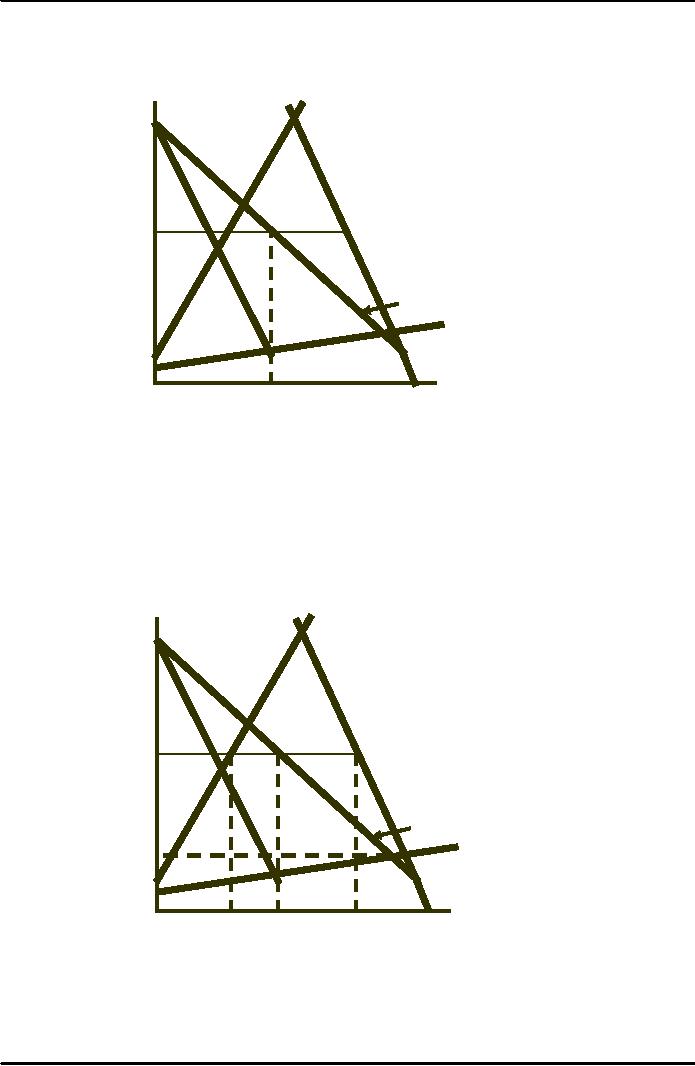
The
Dominant Firm Model
In some
oligopolistic markets, one
large firm has a major
share of total sales, and
a
group
of smaller firms supplies
the remainder of the
market.
The large
firm might then act as
the dominant firm, setting a
price that maximized
its
own
profits.
189

Microeconomics
ECO402
VU
Price
Setting by a Dominant
Firm
SF
The
dominant firm's
demand
Price
D
curve
is the difference
between
market
demand (D)
and
the
supply
of the fringe firms (SF).
P1
MC
P*
At
this price, fringe
DD
firms
sell QF, so
that
total
sales are QT.
P2
MR
Quantity
QF QD
QT
CARTELS
Characteristics
1)
Explicit agreements to set
output and price
2)
May not include all
firms
3)
Most often
international
Examples of
successful cartels
·
OPEC
·
International
Bauxite Association
Examples of
unsuccessful cartels
·
Copper
·
Tin
·
Coffee
·
Tea
·
Cocoa
4)
Conditions for
success
·
Competitive
alternative sufficiently deters
cheating
·
Potential of
monopoly power--inelastic
demand
190
Microeconomics
ECO402
VU
The
OPEC Oil Cartel
TD
SC
Price
TD
is the total world
demand
curve
for oil, and SC is
the
Competitive
supply. OPEC's
demand
is the difference
between
the two.
OPEC's
profits maximizing
quantity
is found at the
P*
intersection
of its MR and
MC
curves. At this
quantity
OPEC
charges price P*.
DOPEC
MCOPEC
MROPEC
QOPEC
Quantity
Cartels
About
OPEC
Very low
MC
TD is
inelastic
Non-OPEC supply
is inelastic
DOPEC
is relatively
inelastic
The
OPEC Oil Cartel
TD
SC
Price
The
price without the
cartel:
·Competitive price (P )
where
C
DOPEC = MCOPEC
P*
DOPEC
MCOPEC
Pc
MROPEC
QOPEC
QC
QT
Quantity
191
Microeconomics
ECO402
VU
The
CIPEC Copper
Cartel
·TD and S are relatively
elastic
C
Price
TD
·D is elastic
CIPEC
·CIPEC has little
monopoly power
S
MCCIPEC
DCIPEC
P*
PC
MRCIPEC
Quantity
QCIPEC
QC
QT
Cartels
Observations
To be
successful:
·
Total
demand must not be very
price elastic
·
Either
the cartel must control
nearly all of the world's
supply or the supply
of
noncartel
producers must not be price
elastic.
192
Table of Contents:
- ECONOMICS:Themes of Microeconomics, Theories and Models
- Economics: Another Perspective, Factors of Production
- REAL VERSUS NOMINAL PRICES:SUPPLY AND DEMAND, The Demand Curve
- Changes in Market Equilibrium:Market for College Education
- Elasticities of supply and demand:The Demand for Gasoline
- Consumer Behavior:Consumer Preferences, Indifference curves
- CONSUMER PREFERENCES:Budget Constraints, Consumer Choice
- Note it is repeated:Consumer Preferences, Revealed Preferences
- MARGINAL UTILITY AND CONSUMER CHOICE:COST-OF-LIVING INDEXES
- Review of Consumer Equilibrium:INDIVIDUAL DEMAND, An Inferior Good
- Income & Substitution Effects:Determining the Market Demand Curve
- The Aggregate Demand For Wheat:NETWORK EXTERNALITIES
- Describing Risk:Unequal Probability Outcomes
- PREFERENCES TOWARD RISK:Risk Premium, Indifference Curve
- PREFERENCES TOWARD RISK:Reducing Risk, The Demand for Risky Assets
- The Technology of Production:Production Function for Food
- Production with Two Variable Inputs:Returns to Scale
- Measuring Cost: Which Costs Matter?:Cost in the Short Run
- A Firms Short-Run Costs ($):The Effect of Effluent Fees on Firms Input Choices
- Cost in the Long Run:Long-Run Cost with Economies & Diseconomies of Scale
- Production with Two Outputs--Economies of Scope:Cubic Cost Function
- Perfectly Competitive Markets:Choosing Output in Short Run
- A Competitive Firm Incurring Losses:Industry Supply in Short Run
- Elasticity of Market Supply:Producer Surplus for a Market
- Elasticity of Market Supply:Long-Run Competitive Equilibrium
- Elasticity of Market Supply:The Industrys Long-Run Supply Curve
- Elasticity of Market Supply:Welfare loss if price is held below market-clearing level
- Price Supports:Supply Restrictions, Import Quotas and Tariffs
- The Sugar Quota:The Impact of a Tax or Subsidy, Subsidy
- Perfect Competition:Total, Marginal, and Average Revenue
- Perfect Competition:Effect of Excise Tax on Monopolist
- Monopoly:Elasticity of Demand and Price Markup, Sources of Monopoly Power
- The Social Costs of Monopoly Power:Price Regulation, Monopsony
- Monopsony Power:Pricing With Market Power, Capturing Consumer Surplus
- Monopsony Power:THE ECONOMICS OF COUPONS AND REBATES
- Airline Fares:Elasticities of Demand for Air Travel, The Two-Part Tariff
- Bundling:Consumption Decisions When Products are Bundled
- Bundling:Mixed Versus Pure Bundling, Effects of Advertising
- MONOPOLISTIC COMPETITION:Monopolistic Competition in the Market for Colas and Coffee
- OLIGOPOLY:Duopoly Example, Price Competition
- Competition Versus Collusion:The Prisoners Dilemma, Implications of the Prisoners
- COMPETITIVE FACTOR MARKETS:Marginal Revenue Product
- Competitive Factor Markets:The Demand for Jet Fuel
- Equilibrium in a Competitive Factor Market:Labor Market Equilibrium
- Factor Markets with Monopoly Power:Monopoly Power of Sellers of Labor