 |
COMPARISON OF FINANCIAL STATEMENTS |
| << INTRODUCTION TO SUBJECT |
| TIME VALUE OF MONEY >> |

Corporate
Finance FIN 622
VU
Lesson
02
COMPARISON
OF FINANCIAL STATEMENTS
Often
it becomes very difficult to compare
financial statements of two or more
business entities due to
i)
Size
ii)
Functional
currency.
However,
we can overcome these
problems by utilizing two effective
tools of comparison. These
tools can
be
used for comparing performance of
single entity over period of
time and to compare two or
more
entities.
1)
COMMON SIZE
STATEMENTS
2)
RATIO ANALYSIS
1)
COMMON SIZE
STATEMENTS
BALANCE
SHEET
AS AT 30
JUNE 2003
2003
2002
2003
2002
%
age
RUPEES
RUPEES
%age
OPERATING
ASSETS
62.87
60.73
Fixed
assets (at cost less
accumulated depreciation)
125,138,737
109,101,363
6.36
10.31
DEFERRED
COST
12,653,681
18,514,377
LONG
TERM DEPOSITS (against
Lease)
2,930,337
827,737
1.47
0.46
140,722,755
128,443,477
CURRENT
ASSETS
Stores
& spares
7,347,476
11,215,891
3.69
6.24
11.37
10.70
Stocks
-do-
22,628,137
19,231,731
1.08
1.79
Trade
debtors
2,149,858
3,211,998
Advances,
deposits, prepayments
and
13.11
9.71
other
receivables
26,089,950
17,450,008
Cash
and bank balances
107,524
110,421
0.05
0.06
100.00
100.00
58,322,945
51,220,049
CURRENT
LIABILITIES
Current
maturity portion of lease
liability
(6,794,240)
(2,821,322)
3.41
1.57
(8,004,000)
4.02
-
Current
maturity portion of Long Term
Loans
-
(6,760,139)
(19,270,244)
3.40
10.73
Short term
borrowings
(30,831,550)
(44,786,359)
15.49
24.93
Creditors,
accruals and other
liabilities
(52,389,929)
(66,877,925)
NET
CURRENT ASSETS
5,933,016
(15,657,876)
TOTAL
ASSETS LESS CURRENT
LIABILITIES
146,655,771
112,785,601
3

Corporate
Finance FIN 622
VU
LONG
TERM LIABILITIES
(1,692,510)
0.85
-
Deferred
Income
-
(37,056,700)
(21,693,585)
18.62
12.07
Due to
directors and
relatives
(926,457)
(926,457)
0.47
0.52
Provident
fund trust and gratuity
payable
(27,828,000)
(47,500,000)
13.98
26.44
Long
term loans
Dealers
& Distributors securities
(23,871,350)
(19,398,600)
11.99
10.80
Long
term portion of leasehold
assets
(12,710,887)
(1,936,847)
6.39
1.08
(104,085,904)
(91,455,489)
TOTAL
NET ASSETS
42,569,867
21,330,112
REPRESENTED
BY :
39,800,000
(30.04)
(22.15)
Share
capital
59,800,000
(27,457,311)
(29,697,066)
13.79
16.53
Profit
& (loss) account
8,227,178
(4.13)
(4.58)
Surplus
on revaluation of fixed assets
8,227,178
Share
deposit money
2,000,000
3,000,000
(1.00)
(1.67)
42,569,867
21,330,112
The
annexed notes form an integral
part of these
accounts.
(199,045,700)
(112,785,601) 100.00
100.00
LAHORE
DATED
Take
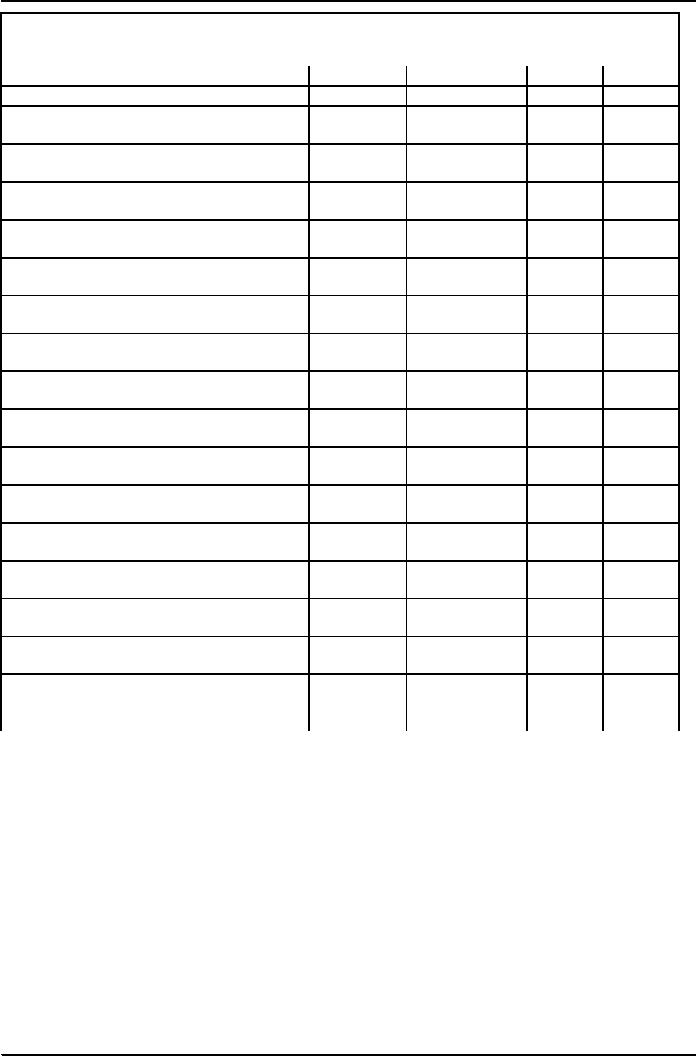
the balance sheet first. Instead of
putting rupee values in
balance sheet, we place %age
against each
line
item with regard to total
asset. The total assets
are taken as 100 and
every line item relationship
with
total
assets expressed in %age is
placed against it. Take a
look at the attached Common Size
balance sheet.
During
2002 total assets were
60.73% of total assets and
that has been increased to
62.87% of total assets
in
2003.
Every line-item on asset
side is expressed as % of total
assets. You are now in a
position to compare
financial
statements over a period of time to
know what developments have
been made over time.
4
Corporate
Finance FIN 622
VU
PROFIT
AND LOSS ACCOUNT
FOR
THE PERIOD ENDED 30TH JUNE,
2003.
2003
2002
2003
2002
RUPEES
RUPEES
SALES
116,811,832
109,030,501
100.00
100.00
COST
OF SALES
(60,117,579)
(58,812,941)
(51.47)
(53.94)
48.53
46.06
GROSS
PROFIT
56,694,253
50,217,560
(56,105,424)
(53,414,839)
OPERATING
EXPENSES
(8,691,429)
(9,173,201)
(7.44)
(8.41)
Administrative
(37,385,642)
(31,684,350)
(32.01)
(29.06)
Selling,
distribution and
amortization
Financial
charges
(10,028,353)
(12,557,288)
(8.59)
(11.52)
OPERATING
PROFIT/(LOSS)
588,828
(3,197,279)
2,387,106
360,873
2.04
0.33
OTHER
INCOME/(LOSS)
2,975,934
(2,836,406)
PROFIT/(LOSS)
BEFORE TAXATION
(148,797)
-
(0.13)
-
WORKERS
PROFIT PARTICIPATION
2,827,137
(2,836,406)
2.42
(2.43)
PROFIT/(L0SS)
BEFORE TAXATION
PROVISION
FOR TAXATION
(587,382)
(545,152)
(0.50)
(0.50)
PROFIT/(L0SS)
AFTER TAXATION
2,239,755
(3,381,558)
(29,697,066)
(26,315,508)
PROFIT/(LOSS)
BROUGHT FORWARD
PROFIT/(LOSS)
CARRIED OVER TO
(27,457,311)
(29,697,066)
BALANCE
SHEET
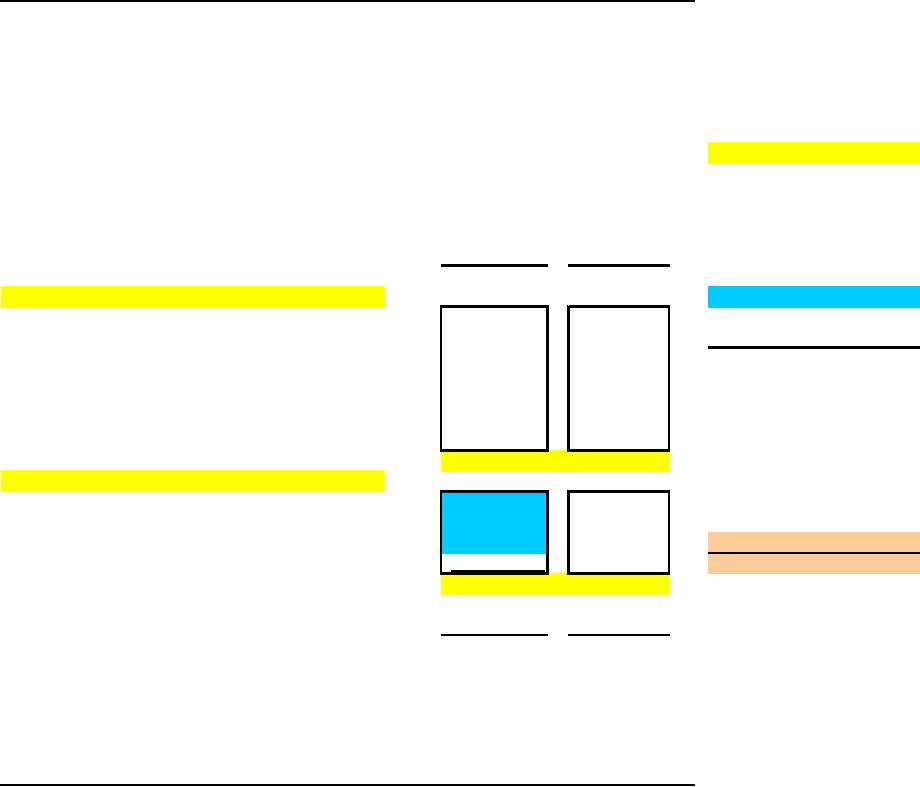
In
common size income statement
every line item is expressed as
%age of sales. In other
words, cost of
sales,
operating expenses and net income
add up to 100%. Let look at
the Common Size Income
Statement.
Cost
of Sales in 2002 was 53.94%
of sales, which dropped to
51.47% in 2003. This is a favorable
symptom
because
any reduction in cost will
lead to increase in profit.
This is confirmed when we
look at the gross
profit.
In 2002 GP was 46.06% of
sales and that increased to
48.53% in 2003. The
comparison here
reveals
that
company has improved it
performance over the year
2002.
Base
Year Analysis: Common
Size analysis is also known
as Vertical Analysis. Base
year analysis is another
tool
of comparing performance and is also
known as Horizontal
Analysis.
5

Corporate
Finance FIN 622
VU
BASE
YEAR /HORIZONTAL ANALYSIS
BALANCE
SHEET
EXAMPLE
HORIZONTAL ANALYSIS
BASE
YEAR
ASSETS
2006
2005
2004
2003
2002
2001
FIXED
ASSETS
145,000.00
125,000.00
100,000.00
160,000.00
155,000.00
145,000.00
160.00
155.00
145.00
145.00
125.00
100.00
55,000.00
56,000.00
CURRENT
ASSETS
50,000.00
58,000.00
70,000.00
65,000.00
140.00
130.00
112.00
116.00
110.00
100.00
TOTAL
ASSETS
230,000.00
220,000.00
201,000.00
203,000.00
180,000.00
150,000.00
153.33
146.67
134.00
135.33
120.00
100.00
CAPITAL
&
LIABILITIES
CURRENT
LAIBILITIES
22,000.00
21,500.00
19,000.00
17,000.00
16,000.00
15,000.00
146.67
143.33
126.67
113.33
106.67
100.00
LONG
TERM
LIABILITIES
15,000.00
13,000.00
12,000.00
11,500.00
10,500.00
10,000.00
150.00
130.00
120.00
115.00
105.00
100.00
EQUITY
193,000.00
185,500.00
170,000.00
174,500.00
153,500.00
125,000.00
154.40
148.40
136.00
139.60
122.80
100.00
TOTAL
CAPITAL
&
LIABILITIES
230,000.00
220,000.00
201,000.00
203,000.00
180,000.00
150,000.00
153.33
146.67
134.00
135.33
120.00
100.00
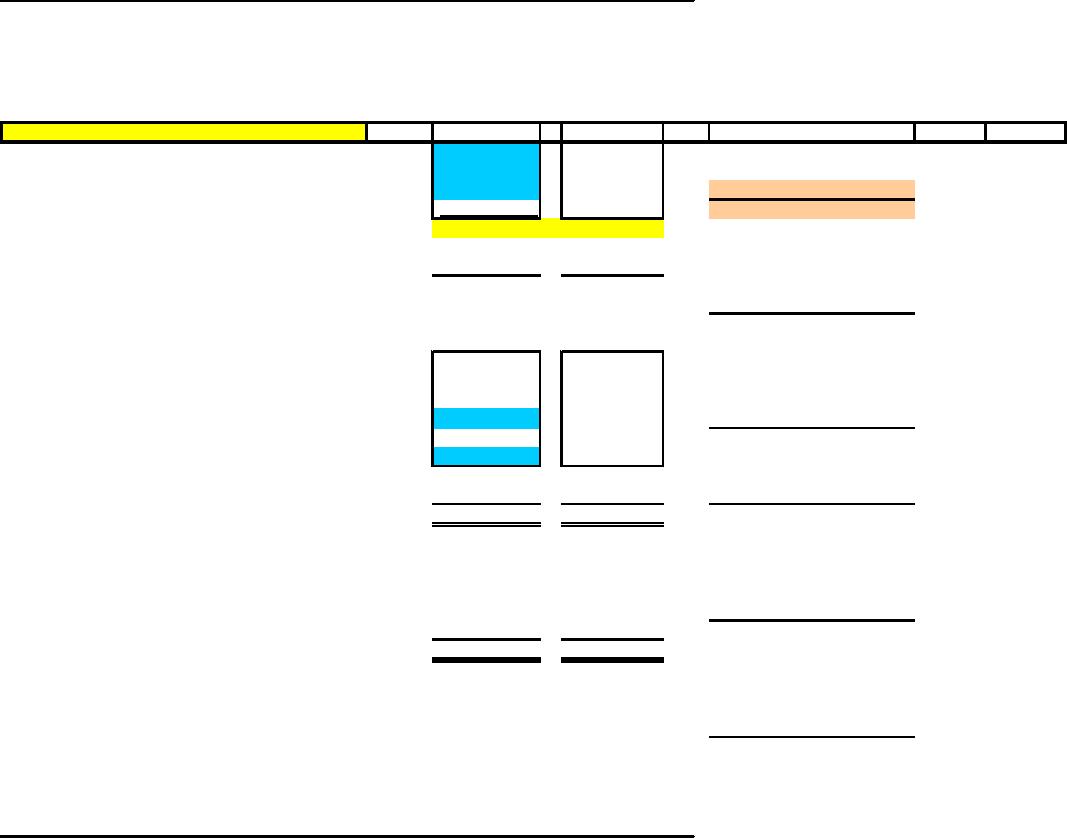
In this
case, performance is compared over,
say, five years period.
The earliest year or the
first year is taken
as
base year and every
line item in the balance sheet of
base year is taken as 100%.
In the subsequent years
amounts
of every line item are
expressed as %age of base
year amount.
You
can see the Base Year analysis
example from the attached
balance sheet. Comparison is being
made
from
the year 2001 to 2006; therefore, the
earliest year i.e., 2001 is
labeled as base year. Total
fixed assets in
2001
were Rs. 100,000/- expressed
as 100% (cell H9: in blue font). In
year 2005 the total investment
in
fixed
assets has risen to Rs.
155,000/-, which is 155% of base
year amount (Rs. 100,000).
This means that
from
2002 to 2005, 55% investment of base
year amount has been injected in
fixed assets and that
further
increased
to 60% at the end of year
2006.
2) Ratios
Analysis:
This is another
widely acknowledged and used
comparison tool for
financial managers. A ratio is
a
relationship
between two or more line
items expressed in %age or number of
times. Financial ratios
are
useful
indicators of a firm's performance and
financial situation. Most ratios can be
calculated from
information
provided by the financial statements. Financial
ratios can be used to
analyze trends and to
6

Corporate
Finance FIN 622
VU
compare
the firm's financials to those of
other firms. In some cases,
ratio analysis can predict
future
bankruptcy.
Financial
ratios can be classified
according to the information they
provide.
7
Corporate
Finance FIN 622
VU
BALANCE
SHEET
AS AT 30 JUNE
2003
NOTES
2003
2002
2003
2002
RUPEES
RUPEES
CURRENT
RATIO
1.11
0.77
OPERATING
ASSETS
Fixed
assets (at cost less accumulated
depreciation)
3
125,138,737
109,101,363
QUICK
RATIO
(0.54)
(0.31)
DEFERRED
COST
4
12,653,681
18,514,377
LONG
TERM DEPOSITS (against
Lease)
2,930,337
827,737
TOTAL
DEBT RATIO
140,722,755
128,443,477
CURRENT
ASSETS
=Total
Debt/Total Assets
0.31
0.40
OR
Stores
& spares
7,347,476
11,215,891
Total
Assets - Equity
0.79
0.88
Stocks
5
22,628,137
19,231,731
Total
Assets
Trade
debtors
6
2,149,858
3,211,998
Advances,
deposits, prepayments
and
DEBT -
EQUITY RATIO
other
receiveables
7
26,089,950
17,450,008
Cash
and bank balances
8
107,524
110,421
=Total
Debt / Equity
(1.46)
(3.35)
58,322,945
51,220,049
CURRENT
LIABILITIES
Current
maturity portion of lease
liability
9
(6,794,240)
(2,821,322)
TIMES
INTEREST EARNED
Current
maturity portion of Long
Term Loans
(8,004,000)
-
Short
term borrowings
10
(6,760,139)
(19,270,244)
Earning
before Tax
0.30
0.23
(30,831,550)
Creditors,
accruals and other
liabilities
11
(44,786,359)
Interest
Expense
(52,389,929)
(66,877,925)
NET
CURRENT ASSETS
5,933,016
(15,657,876)
INVENTORY
TURNOVER
8
Corporate
Finance FIN 622
VU
CURRENT
LIABILITIES
2003
2002
2003
2002
Current
maturity portion of lease
liability
9
(6,794,240)
(2,821,322)
TIMES
INTEREST EARNED
Current
maturity portion of Long
Term Loans
(8,004,000)
-
Short
term borrowings
10
(6,760,139)
(19,270,244)
Earning
before Tax
0.30
0.23
(30,831,550)
(44,786,359)
Interest
Expense
Creditors,
accruals and other
liabilities
11
(52,389,929)
(66,877,925)
NET
CURRENT ASSETS
5,933,016
(15,657,876)
INVENTORY
TURNOVER
TOTAL
ASSETS LESS CURRENT
LIABILITIES
146,655,771
112,785,601
Cost
of Good Sold
(2.87)
(3.06)
Avg.
Inventory
LONG
TERM LIABILITIES
Deferred
Income
(1,692,510)
-
Due to
directors and
relatives
(37,056,700)
(21,693,585)
A/R
TURNOVER
Provident
fund trust and gratuity
payable
12
(926,457)
(926,457)
Long
term loans
13
(27,828,000)
(47,500,000)
Sales
54.33
33.94
Dealers&Distributors
securities
14
(23,871,350)
(19,398,600)
Account
Receivable
Long
term portion of leasehold
assets
(12,710,887)
(1,936,847)
(104,085,904)
(91,455,489)
Avg
Collection Period
365
6.72
10.75
TOTAL
NET ASSETS
42,569,867
0
21,330,112
A R
Turnover
REPRESENTED
BY :
Share
capital (5,980,000)
15
59,800,000
39,800,000
PAYABLE
TURNOVER
Profit
& (loss) account
(27,457,311)
(29,697,066)
Surplus
on revaluation of fixed assets
8,227,178
8,227,178
Cost
of Good Sold
(2.42)
(1.61)
Share
deposit money
2,000,000
3,000,000
Trade
Creditors
42,569,867
21,330,112
The
annexed notes form an
integral part of these
accounts.
NET
PROFIT RATIO
LAHORE
-
DATED
Net
Income
2.420
(2.601)
Sales
9
Corporate
Finance FIN 622
VU
2003
2002
2003
2002
NET
PROFIT RATIO
-
Net
Income
2.420
(2.601)
Sales
RETURN
ON ASSETS
11 CREDITORS,
ACCRUED AND OTHER
LIABILITIES
Net
Income
2.259
(2.5998)
Creditors
24,820,277.00
36,565,866.00
Total
Assets
Advances
from customers
57,178.00
17,650.00
Accrued
liabilities
2,710,813.00
2,847,749.00
Accrued
interest on secured
loans
1,200,010.00
2,844,012.00
RETURN
ON EQUITY
Sales
tax payable
1,571,414.00
1,800,396.00
Income
tax payable -
employees
12,131.00
15,920.00
Net
Income
6.64
(13.30)
Other
liabilities
310,930.00
694,766.00
Equity
WPPF
Payable
148,796.71
-
30,831,549.71
44,786,359.00
MARKET
RATIOS
Earning
Per Share
Net
Income
0.47
(0.71)
Total
Shares (O/S)
10

Corporate
Finance FIN 622
VU
The
following types of ratios
frequently are used:
1. Short Term
Solvency or Working Capital
ratios
2.
Long term solvency
ratios
3.
Asset management turnover
ratios
4.
Profitability ratios
5.
Market value ratios
Short
Term Solvency or Working
Capital ratios:
These
ratios provide information
about a firm's ability to
meet its short-term financial
obligations. They are of
particular
interest to those extending short-term credit to the
firm. Two frequently-used liquidity
ratios are the
current
ratio (or working capital
ratio) and the quick
ratio.
The
current ratio is the ratio of current
assets to current liabilities:
Current Ratio =
Current Assets/Current Liabilities
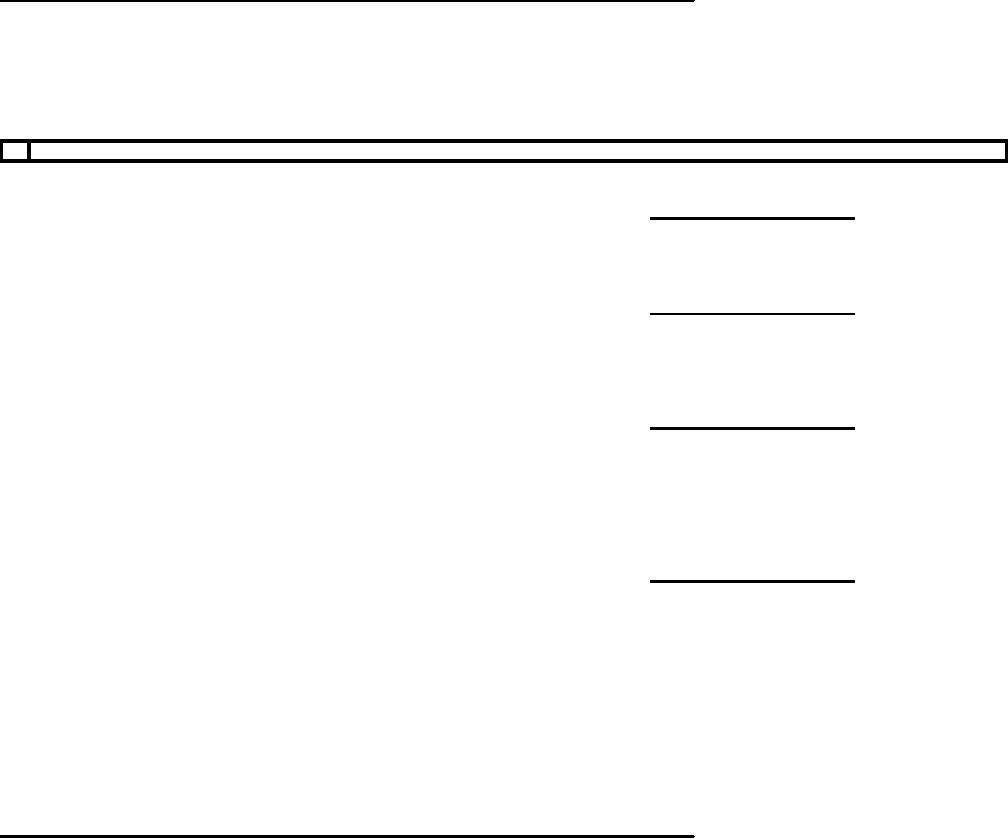
Keeping
the comparison purpose in our
mind, you can see that in
the attached balance sheet this
ratio improved in
2003
over 2002. Normally, this
ratio is expressed as 0.77:1meaning
that current assets are 77% of current
liabilities in
2002.
This was improved at the end
of year 2003 when our
current assets were more
than liabilities. The ratio
in
2003
is 1.11:1.
Short-term
creditors prefer a high current
ratio since it reduces their
risk. Shareholders may prefer a lower
current
ratio
so that more of the firm's
assets are working to grow the
business. Typical values for the current
ratio vary by
firm
and industry. For example, firms in
cyclical industries may maintain a higher
current ratio in order to
remain
solvent
during downturns. One drawback of the current
ratio is that inventory may
include many items that
are
difficult
to liquidate quickly and
that have uncertain liquidation
values. The quick ratio is
an alternative measure of
liquidity
that does not include
inventory in the current assets. The
quick ratio is defined as
follows:
Quick
Ratio = (Current Assets Inventory)/
Current Liabilities
This
ratio also shows the investment level in
inventories. Excessive investment in inventories is
often considered as
inefficient
use of resources.
The
current assets used in the quick
ratio are cash, accounts
receivable, and notes
receivable. These assets
essentially
are
current assets less inventory.
The quick ratio often is
referred to as the acid test.
Asset
Turnover Ratios:
Asset
turnover ratios indicate of how
efficiently the firm utilizes
its assets. They sometimes
are referred to as
efficiency
ratios, asset utilization
ratios, or asset management
ratios. Two commonly used
asset turnover ratios
are
receivables
turnover and inventory
turnover.
Receivables
turnover is an indication of how
quickly the firm collects
its accounts receivables and
is defined as
follows:
Receivables
Turnover = Annual Credit
Sales / Accounts Receivable
The
receivables turnover often is reported in
terms of the number of days that credit
sales remain in
accounts
receivable before they are collected.
This number is known as the collection
period.
The
collection period also can
be written as:
Average
Collection Period = 365 / Receivables
Turnover
Another
major asset turnover ratio is
inventory turnover. It is the cost of
goods sold in a time
period
divided
by the average inventory level during
that period:
Inventory
Turnover = Cost of Goods
Sold/Inventory
The
variations in formula of inventory
turnover relates to the denominator as
some financial managers
take
closing
inventory value and other
prefer to have average
inventory, which we can work
out by adding
opening
and closing inventories and
dividing by 2.
The
inventory turnover often is reported as
the inventory period, which is the number
of days worth of
inventory
on hand, calculated by dividing the
inventory by the average daily cost of
goods sold:
Inventory
Period = Annual Cost of Goods
Sold / Average
Inventory
The
inventory period also can be
written as:
Inventory
Period = 365/Inventory Turnover
11

Corporate
Finance FIN 622
VU
Other
asset turnover ratios include
fixed asset turnover and
total asset turnover.
Leverage
or Long term solvency
Ratios
Financial
leverage ratios provide an
indication of the long-term solvency of
the firm. Unlike liquidity
ratios
that
are concerned with short-term
assets and liabilities, financial
leverage ratios measure the extent
to
which
the firm is using long term
debt.
The
debt ratio is defined as
total debt divided by total
assets:
Debt
Ratio = Total Debt/Total
Assets
The
debt-to-equity ratio is total
debt divided by total
equity:
Debt-to-Equity
Ratio = Total Debt/Total
Equity
Debt
ratios depend on the classification of
long-term leases and on the
classification of some items as
long-
term
debt or equity. The times
interest earned ratio
indicates how well the
firm's earnings can cover
the
interest
payments on its debt. This
ratio also is known as the
interest coverage and is
calculated as follows:
Interest
Coverage = EBIT/Interest
Charges
Where
EBIT = Earnings before Interest
and Taxes Profitability
Ratios Profitability ratios
offer several
different
measures of the success of the firm at
generating profits.
The
gross profit margin is a
measure of the gross profit
earned on sales. The gross
profit margin
considers
the
firm's cost of goods sold,
but does not include other
costs. It is defined as
follows:
Gross
Profit Margin = Sales - Cost
of Goods Sold/Sales
Return on
assets is a measure of how
effectively the firm's assets
are being used to generate
profits. It is
defined
as:
Return on
Assets = Net Income/Total
Assets
Return on
equity is the bottom line
measure for the shareholders,
measuring the profits earned
for each
dollar
invested in the firm's stock. Return on
equity is defined as follows:
Return on
Equity = Net
Income/Equity
Market
Ratios:
Earning
Per Share:
This
explains the portion of net income
attributable to one common share. It is
calculated as:
EPS =
net income / No. of O/S
shares
P/E
ratio = price per
share/EPS
Market
to Book Value:
= MV
per share/BV per
share
Use
and Limitations of Financial
Ratios
Attention
should be given to the following issues
when using financial
ratios:
A
reference point is needed. To be
meaningful, most ratios must be
compared to historical values of
the
same
firm, the firm's forecasts, or
ratios of similar firms.
Most
ratios by themselves are not
highly meaningful. They should be viewed as
indicators, with several of
them combined to
paint a picture of the firm's
situation.
Year-end
values may not be
representative. Certain account balances
that are used to calculate
ratios may
increase
or decrease at the end of the accounting
period because of seasonal
factors. Such changes
may
distort
the value of the ratio. Average
values should be used when they
are available. Ratios are
subject to
the
limitations of accounting methods.
Different accounting choices
may result in significantly
different
ratio
values.
12
Table of Contents:
- INTRODUCTION TO SUBJECT
- COMPARISON OF FINANCIAL STATEMENTS
- TIME VALUE OF MONEY
- Discounted Cash Flow, Effective Annual Interest Bond Valuation - introduction
- Features of Bond, Coupon Interest, Face value, Coupon rate, Duration or maturity date
- TERM STRUCTURE OF INTEREST RATES
- COMMON STOCK VALUATION
- Capital Budgeting Definition and Process
- METHODS OF PROJECT EVALUATIONS, Net present value, Weighted Average Cost of Capital
- METHODS OF PROJECT EVALUATIONS 2
- METHODS OF PROJECT EVALUATIONS 3
- ADVANCE EVALUATION METHODS: Sensitivity analysis, Profitability analysis, Break even accounting, Break even - economic
- Economic Break Even, Operating Leverage, Capital Rationing, Hard & Soft Rationing, Single & Multi Period Rationing
- Single period, Multi-period capital rationing, Linear programming
- Risk and Uncertainty, Measuring risk, Variability of returnHistorical Return, Variance of return, Standard Deviation
- Portfolio and Diversification, Portfolio and Variance, RiskSystematic & Unsystematic, Beta Measure of systematic risk, Aggressive & defensive stocks
- Security Market Line, Capital Asset Pricing Model CAPM Calculating Over, Under valued stocks
- Cost of Capital & Capital Structure, Components of Capital, Cost of Equity, Estimating g or growth rate, Dividend growth model, Cost of Debt, Bonds, Cost of Preferred Stocks
- Venture Capital, Cost of Debt & Bond, Weighted average cost of debt, Tax and cost of debt, Cost of Loans & Leases, Overall cost of capital WACC, WACC & Capital Budgeting
- When to use WACC, Pure Play, Capital Structure and Financial Leverage
- Home made leverage, Modigliani & Miller Model, How WACC remains constant, Business & Financial Risk, M & M model with taxes
- Problems associated with high gearing, Bankruptcy costs, Optimal capital structure, Dividend policy
- Dividend and value of firm, Dividend relevance, Residual dividend policy, Financial planning process and control
- Budgeting process, Purpose, functions of budgets, Cash budgetsPreparation & interpretation
- Cash flow statement Direct method Indirect method, Working capital management, Cash and operating cycle
- Working capital management, Risk, Profitability and Liquidity - Working capital policies, Conservative, Aggressive, Moderate
- Classification of working capital, Current Assets Financing Hedging approach, Short term Vs long term financing
- Overtrading Indications & remedies, Cash management, Motives for Cash holding, Cash flow problems and remedies, Investing surplus cash
- Miller-Orr Model of cash management, Inventory management, Inventory costs, Economic order quantity, Reorder level, Discounts and EOQ
- Inventory cost Stock out cost, Economic Order Point, Just in time (JIT), Debtors Management, Credit Control Policy
- Cash discounts, Cost of discount, Shortening average collection period, Credit instrument, Analyzing credit policy, Revenue effect, Cost effect, Cost of debt o Probability of default
- Effects of discountsNot effecting volume, Extension of credit, Factoring, Management of creditors, Mergers & Acquisitions
- Synergies, Types of mergers, Why mergers fail, Merger process, Acquisition consideration
- Acquisition Consideration, Valuation of shares
- Assets Based Share Valuations, Hybrid Valuation methods, Procedure for public, private takeover
- Corporate Restructuring, Divestment, Purpose of divestment, Buyouts, Types of buyouts, Financial distress
- Sources of financial distress, Effects of financial distress, Reorganization
- Currency Risks, Transaction exposure, Translation exposure, Economic exposure
- Future payment situation hedging, Currency futures features, CF future payment in FCY
- CFfuture receipt in FCY, Forward contract vs. currency futures, Interest rate risk, Hedging against interest rate, Forward rate agreements, Decision rule
- Interest rate future, Prices in futures, Hedgingshort term interest rate (STIR), ScenarioBorrowing in ST and risk of rising interest, Scenariodeposit and risk of lowering interest rates on deposits, Options and Swaps, Features of opti
- FOREIGN EXCHANGE MARKETS OPTIONS
- Calculating financial benefitInterest rate Option, Interest rate caps and floor, Swaps, Interest rate swaps, Currency swaps
- Exchange rate determination, Purchasing power parity theory, PPP model, International fisher effect, Exchange rate system, Fixed, Floating
- FOREIGN INVESTMENT: Motives, International operations, Export, Branch, Subsidiary, Joint venture, Licensing agreements, Political risk