 |
Introduction
to Sociology SOC101
VU
Lesson
38
POPULATION
PROFILE OF PAKISTAN
(Continued)
Composition
In
lecture 37 we looked at the size of
population. Lecture 38 shall focus on the
composition of population
of
Pakistan as well as some implications of
the Population Planning Program. In the
composition of
population
first of let us look at the
age distribution of the people of
Pakistan.
Age
Distribution
According
to 1998 Population Census of
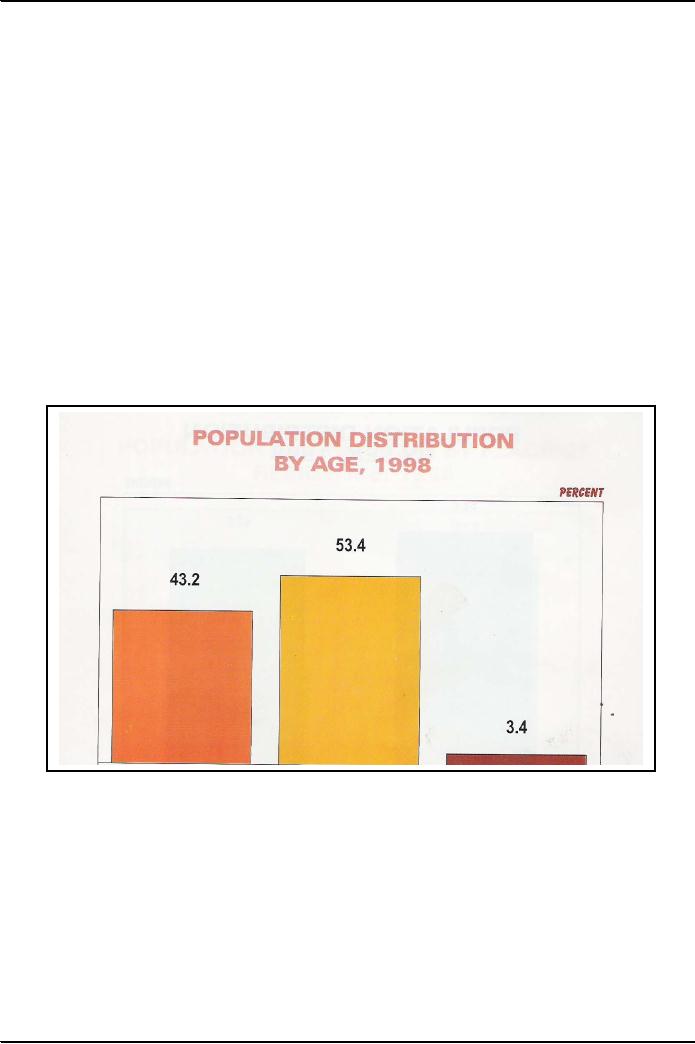
Pakistan, 43 percent of the population
was of children under 15
years,
53 percent was between the
ages of 15-64 years, and
about 4 percent was 65 years
and over (see
fig.
1).
This information shows that a
big proportion of the population
has been of children
implying that they
are
dependents on the economy of the country.
About four percent of the
population happens to be of
old
persons,
another group of dependents. About
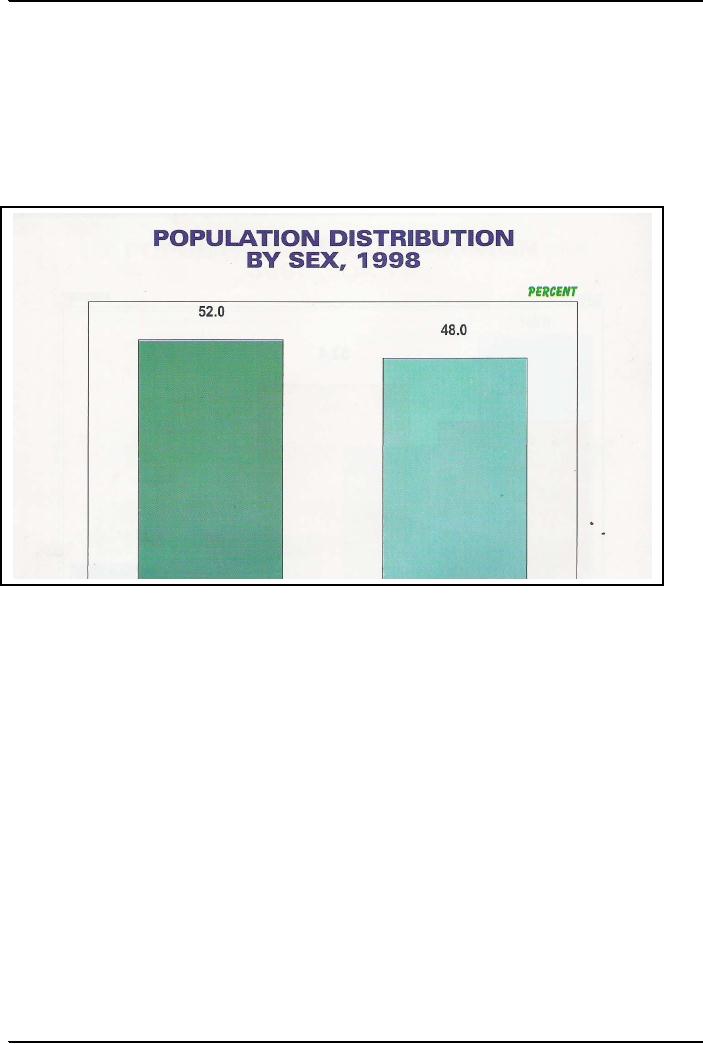
one half of the population is
that of women, who, with
the
exception
of few, are usually
considered as dependents. In this way the
age structure of the population
of
Pakistan
shows that majority (nearly
two thirds) of them are dependents. Of
the dependents, children
need
special
services like health, education,
playground, and family care. In this
way the young population
puts
special
demand on the resources of the country.
Similarly the senior citizens need
special services.
Figure
1
<
15 yrs.
15-64
yrs.
65+
yrs
92
Introduction
to Sociology SOC101
VU
Sex
Composition
5q425.8r]T6W
/25.7mc.eT2e6uctionCeu cm6f2o 7355.6 73tionCe7
ucyri0007 Tw[(Int 63T2e4mi27we995uctionoc
Tw(-25
93
Introduction
to Sociology SOC101
VU
Figurer
3
Population
Pyramid of Pakistan - 1998
Population
Pyramid of Pakistan 1998
Elderly
65 + Population
4.8%
Females
in
Reproductive
Productive
53%
Age
Group
age
group 15-
64
22%
Child
Population
0-14
43%
Prior
to the industrial revolution the age
and sex pyramids of the developed
countries also looked like
those
of
the present day developing
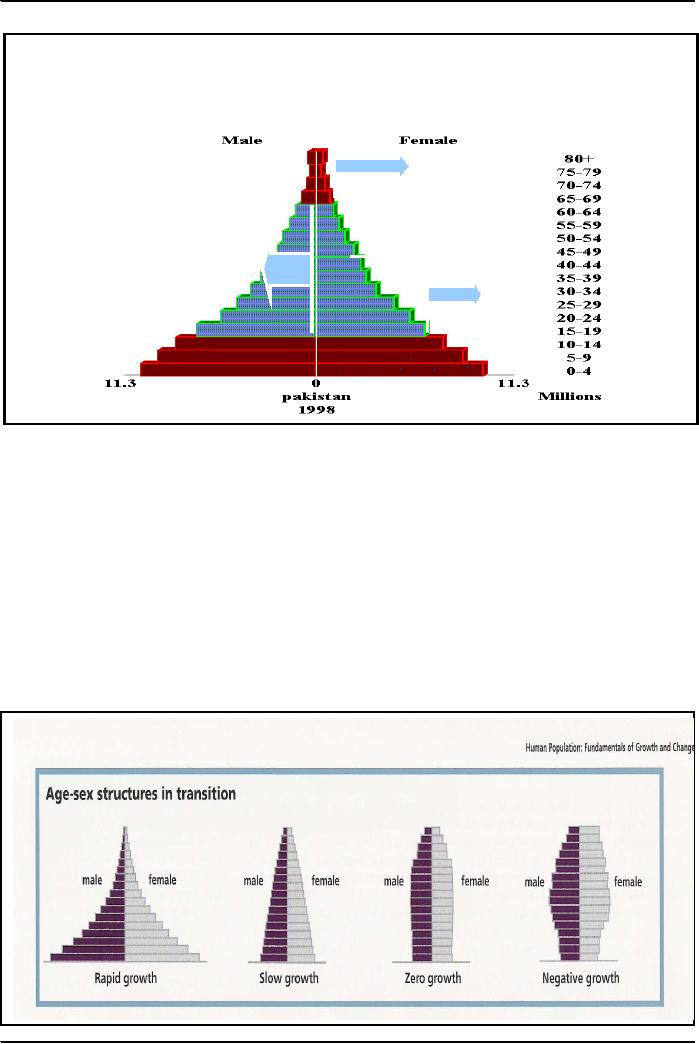
countries. Just by looking at the
population pyramid one could
easily tell
whether
this pyramid is that of a highly developed
country, a developed country, or that of
a developing
country
(see fig. 4). As one
can see from the figure, the base of the
population pyramid of a developing
country
is very broad indicating that the
population has a large number of
children. The population of
such
countries
has the potential of rapid
growth. Sex ratio is in
favor of males. Then there
is a sharp tapering off
of
the pyramid whereby it becomes conical.
At the senior citizen's age the
proportion of population is very
small.
Figure
4
Prior
to the industrial revolution the age
and sex pyramids of the developed
countries also had similar
shape
as
that of Pakistan. Presently
although the age and sex
pyramids of the developed countries have
quite a
different
shape still they are being
called pyramids.
A
94
Introduction
to Sociology SOC101
VU
As
the countries move on the scale of
development, its birth rates
start falling and the base
of the pyramid
does
not remain broad and also it
does not remain as steep as
it was seen in case of
developing countries.
The
bars indicating the male and
female distribution start
becoming different. The bars
indicating the
females
start becoming longer than
those of bars for males.
Since the pyramid is no more conical,
therefore
it
indicates that the proportion of
old persons in the population
starts increasing. On the whole
the
population
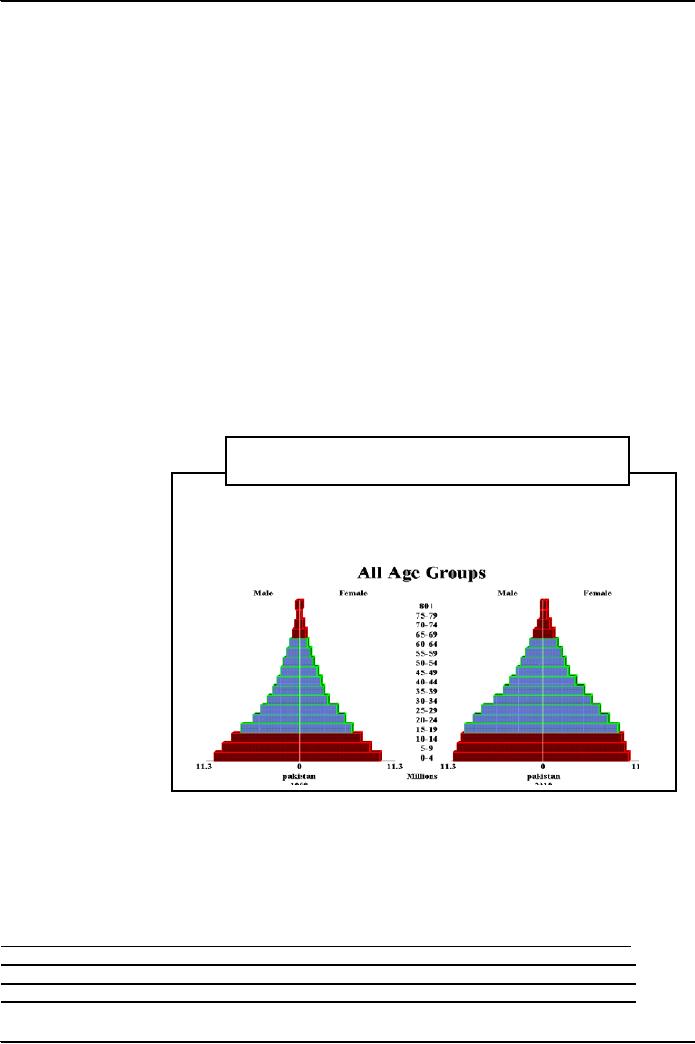
of such countries shows slow
growth rate.
Countries
with zero population growth
have a barrel shaped pyramid. Here
different bars representing
age
become
almost equal except at the
top for the senior citizen.
The bars at each age
for females are
either
equal
to the bars for males or
these are longer than the
bars for males.
There
is also a pyramid showing "negative
growth" of population. In this pyramid the
base of the pyramid
is
quite squeezed indicating
that there are no children.
This pyramid starts bulging
out from the middle
suggesting
some increase in adult
population which is primarily
due to immigrants entering the country
to
fill
the gap created by the declining
fertility of the local population.
This pyramid has become
comparatively
broad
at the top due to the increase in the
number of old people. Countries with such
population have
"aging"
population.
The
present age and sex pyramid
of Pakistan shows high
growth potential for
population. With the
future
socioeconomic
developments it is expected there
will be a decline in fertility.
With this decline in
fertility
the
lower bars of the pyramid start getting
shorter than what was in 1998.
Also their length starts
becoming
equal
to each other. The bars on
top of the pyramid representing the old
people above 65 year start
getting
bigger
than the bars in the previous pyramid
(see fig. 5).
Women
in Reproductive Age 42.36
million
Figure
5
62.79
million
Population
Pyramids of Pakistan
Literacy
Composition
Literacy
has
been
considered
to be a
crucial
variable in the
development
of
a
Old
Age 6.46 million
Old
Age 6.46 million
country.
Pakistan
started
with a very low
literacy
rate. In 1961
Women
in
Women
in
only
17 percent of the
Reproductive
Reproductive
Age
28.8
Age
28.8
population
aged 10 year
million
million
and
above was literate.
There
have been small
55.54
55.54
million
million
increases
in the literacy
rates
in the country.
Table
1 shows that at
the
time of third population census
(1972) there was small
increase of 5 percentage points
over the previous
population
census of 1961 and an
increase of small percentage
points have been observed at
the time of
every
population census. During the
year 2004 literacy rate in
the country has been
estimated to be at 54
percent.
Table
1: Literacy rate
(%)
________________________________________________________________________
Year
Rate
Year
Rate_______
.
1961
17
1990
35
.
1972
22
1998
40
.
1981
26
2004
54
.
95
Introduction
to Sociology SOC101
VU
Female
literacy rates are much
lower than the male
population. Similarly literacy rates in
the rural area are
lower
than the urban areas. The
literacy situation of the rural women
appears to be the lowest.
Despite
the fact that literacy rate
has been increasing in
Pakistan, it is interesting to note that
the absolute
number
of illiterates in the country has also
been increasing. The
information provided in table 2 shows
that
in
1961 there were 22 million
persons who were illiterate
and by the year 2004 this number
has increased to
69
million, which is a more
than three times increase.
During the same period, the
literacy rate
increased
from
17 percent to 54 percent, more
than three times increase.
It might look ironical to
have such a
scenario
but this reality has emerged
due to the rapid growth of
population. The high growth
rate of
population
has been one of the
important factors that
neutralize the achievement of increase in
literacy.
Table
2: Absolute number of illiterates (in
million)
________________________________________________________________________
Year
No.
Year
No.
.
1961
22
1990
52
1972
33
1998
55
1981
42
2004
69
.
Distribution
of Population
The
distribution of population may be
looked at from different
dimensions: rural-urban
distribution,
provincial
distribution, distribution by different
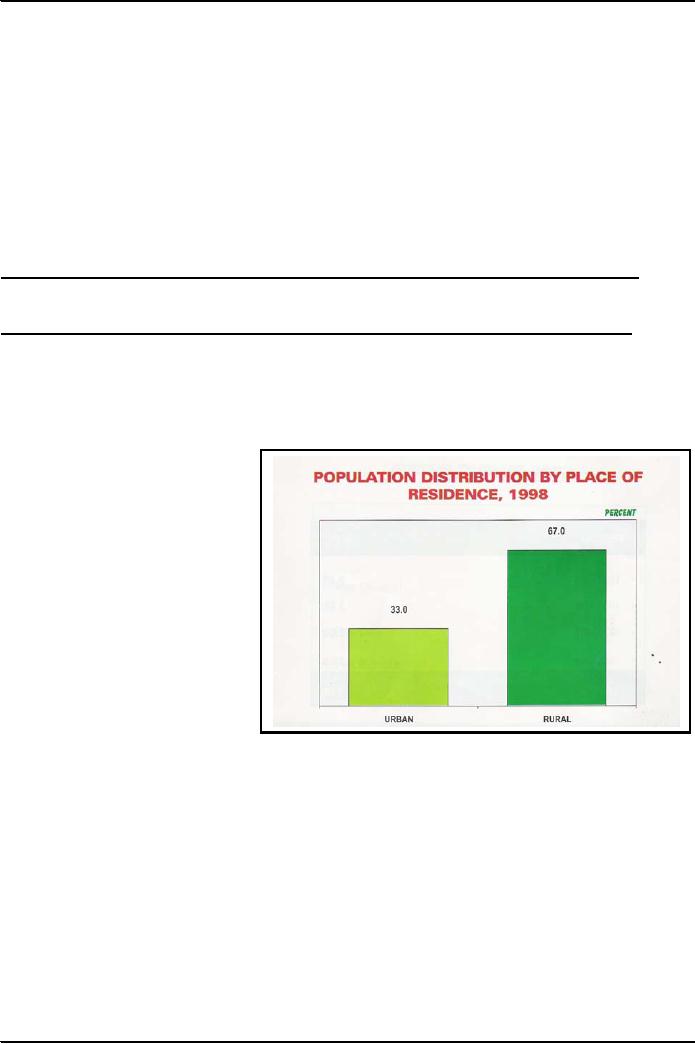
city size, etc. Rural-urban
distribution, as seen in the
figure
6,
shows that as of 2004 every
third person was living in
cities. At the time of partition every
fifth person
was
living in cities. An increase
in
urban
population has mostly been
due
to
migration of rural population
to
the
urban areas.
Most
of such
migrants
come to cities in search
of
job.
Figure
6
Urban
Population
Implications
of Population
Program
Given
the scenario of population
growth
in the country, the
government
of Pakistan started population program
about fifty years back.
Over the years a good
amount
of
effort has gone into it
for the creation of awareness about
family planning, changing the
attitudes of
couples
in its favor, and motivating
the couples for the adoption of
family planning practices (the
use of
contraceptives).
As an outcome of government investments as
well as through the efforts of
NGOs some
of
the parameters of population are given in
table 3. The data show
that there has been
progress on three
important
parameters of knowledge about family
planning, the use of contraceptives,
and fertility rate.
It
has
been found that as of 2004
there were 96 percent
couples who were in the
know-of family planning
but
only
a little over one third
were using some family
planning method (contraceptive). There
appears to be a
big
gap between the knowledge about family
planning and the practicing of family
planning. It has been
found
that the fertility rate (the
total number of children born to a
woman during her life time)
has declined
for
example from 5.4 children
per woman in 1991, to 4.9 in
1997, to 4.1 children in
2004.
96
Introduction
to Sociology SOC101
VU
Table
3: Population parameters (1991 to
2004)
______________________________________________________________________
Parameter
1991
1997
2004
.
Knowledge
(%)
78
94
96
Use
of Contraceptives 12
24
34
Fertility
rate
5.4
4.9
4.1
.
Looking
at the world situation, the information
provided in table 4 shows
that the population growth
rate
(PGR)
of the world in 2002 was 1.3
percent, and the contraceptive prevalence
rate (CPR) of 61 percent.
In
the
more developed regions of the world the
PGR was 0.1 and
CPR 68 percent whereas in the
less
developed
regions the corresponding PGR was
1.6 and CPR was 60
percent. Asian figures show a
PGR of
1.3
percent and CPR of 64.
Comparing with this situation it looks
that Pakistan has yet to
cover long
distance
to come closer to the average
figures of Asia or of less developed
regions, what to think about the
figures
of more developed regions.
Table
4: Population Growth Rate (PGR) and
Contraceptive Prevalence
Rate
(CPR)
2002
________________________________________________________________________
Regions
PGR
(%)
CPR
(%)
.
World
1.3
61
More
Developed
0.1
68
Less
Developed
1.6
60
Asia
1.3
64
.
Comparing
Pakistan with some of the
Muslim countries, the information
provided in table 5 shows
that
Pakistan
is way behind Iran, Turkey,
Morocco, Indonesia, Egypt and
Bangladesh on the counts of
CPR,
PGR,
and TFR. A program which is
well accepted in some other
Muslim countries, why it is
not that much
accepted
in Pakistan? We have to explore the
reasons for such
differences.
Table
5: PGR, CPR, and Total
Fertility Rate (TFR),
2002
_____________________________________________________________________
Muslim
countries
TFR(%)
PGR(%)
CPR(%)
.
Egypt
3.5
2.0
56
Morocco
3.1
1.9
58
Turkey
2.5
1.5
64
Iran
2.5
1.2
74
Indonesia
2.6
1.6
57
Bangladesh
3.3
1.7
55
Pakistan
(2004)
4.1
1.9
37
.
Keeping
in view the existing parameters of
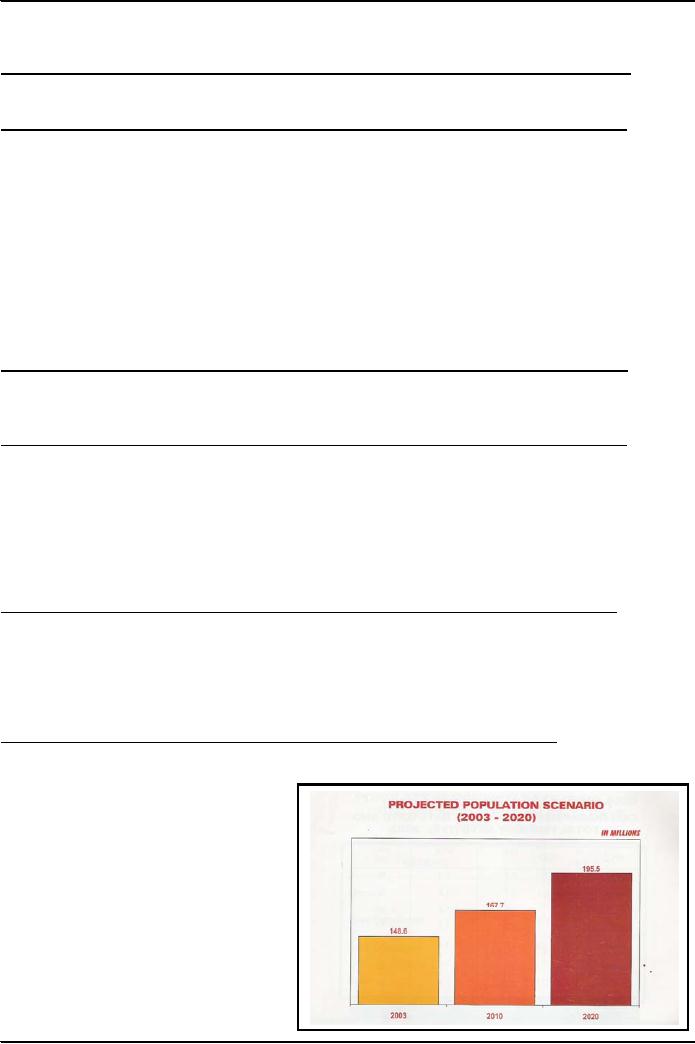
population program the population projections
made by the
government
suggest that the population
of
Pakistan
is going to increase from
148.6
million
in 2003 to 167.7 million in
2010,
and
to 195.5 million in 2020
(see fig. 7).
Also
2020 is the year when
Pakistan is
expected
to have population stabilization.
We
shall discuss this concept of
population
stabilization
later. It has been
further
projected
that the population of Pakistan
is
going
to double by the year
2040.
Figure
7
97

Introduction
to Sociology SOC101
VU
98
Table of Contents:
- THE ORIGINS OF SOCIOLOGY:Auguste Comte, The Fields of Sociology
- THE SOCIOLOGICAL PERSPECTIVE:Society affects what we do
- THEORETICAL PARADIGMS:Salient Paradigms, Critical Evaluation
- SOCIOLOGY AS SCIENCE:Empirical, Verifiable, Cumulative, Self-Correcting
- STEPS IN SOCIOLOGICAL INVESTIGATION:Exploration/Consultation
- SOCIAL INTERACTION:Social Status, ROLE, The Social Construction of Reality
- SOCIAL GROUPS:Primary and Secondary Groups, Reference Group, Networks
- ORGANIZATIONS:Utilitarian Organizations, Coercive Organizations
- CULTURE:Universality, Components of Culture, Symbols, Language
- CULTURE (continued):Beliefs, Norms, Cultural Diversity
- CULTURE (continued):Culture by social class, Multiculturalism, Cultural Lag
- SOCIALIZATION: HUMAN DEVELOPMENT, NATURE, Social Isolation
- UNDERSTANDING THE SOCIALIZATION PROCESS
- AGENTS OF SOCIALIZATION:The Family, The School, Peer Groups, The Mass Media
- SOCIALIZATION AND THE LIFE COURSE:CHILDHOOD, ADOLESCENCE
- SOCIAL CONTROL AND DEVIANCE:Crime, Deviants, Stigma, Labeling
- THE SOCIAL FOUNDATIONS OF DEVIANCE:Cultural relativity of deviance
- EXPLANATIONS OF CRIME:Sociological explanations
- EXPLANATIONS OF CRIME -- CONTINUED:White-Collar Crime, Conflict Theory
- SOCIAL DISTRIBUTION OF CRIME: EXPLANATIONS, Gender and Crime
- SOCIAL STRATIFICATION: INTRODUCTION AND SIGNIFICANCE
- THEORIES OF CLASS AND STRATIFICATION – I:Critical evaluation
- THEORIES OF SOCIAL CLASS AND STRATIFICATION – II
- THEORIES OF CLASS AND SOCIAL STRATIFICATION – III
- SOCIAL CLASS AS SUBCULTURE
- SOCIAL MOBILITY:Structural factors, Individual factors, Costs
- THE FAMILY: GLOBAL VARIETY, Marriage Patterns, Patterns of Descent
- FUNCTIONS OF FAMILY:Reproduction, Social placement
- FAMILY AND MARRIAGE IN TRANSITION:Family is losing functions
- GENDER: A SOCIAL CONSTRUCTION, Gender socialization
- GENDER SOCIALIZATION:Role of family, Gender Stratification
- EXPLANATIONS OF GENDER INEQUALITY:Conflict Explanations, Feminism
- FUNCTIONS OF SCHOOLING:Cultural Innovation, School Tracking
- ISSUES IN EDUCATION:Low Enrollment, High Dropout, Gender Disparity
- POPULATION STUDY AND ITS SIGNIFICANCE:Crude Birth Rate
- THEORY OF POPULATION GROWTH:Theory of Demographic Transition
- POPULATION PROFILE OF PAKISTAN:World Population Growth
- POPULATION PROFILE OF PAKISTAN (Continued):Age Distribution, Sex Composition
- IMPLICAIONS OF POPULATION GOWTH:Additional GDP needed per year
- POPULATION POLICY:Goals of Population Policy, Objectives, Strategies
- ENVIRONMENT AND SOCIETY:Global Dimension, Historical Dimension
- ENVIRONMENTAL ISSUES:Preserving Clean Water, Clearing the Air
- SOCIAL CHANGE:Social change is controversial.
- CAUSES OF SOCIAL CHANGE:Culture and Change, Conflict and Change, Modernization
- MODERNITY AND POST MODERNITY:Cultural Patterns, Post-modernity