 |
Income & Substitution Effects:Determining the Market Demand Curve |
| << Review of Consumer Equilibrium:INDIVIDUAL DEMAND, An Inferior Good |
| The Aggregate Demand For Wheat:NETWORK EXTERNALITIES >> |
Microeconomics
ECO402
VU
Lesson
11
Income
& Substitution Effects
A
fall
in the price of a good has
two effects: Substitution &
Income
Substitution Effect
�Consumers will tend to
buy more of the good
that has become relatively
cheaper,
and
less of the good that is
now relatively more
expensive.
Income
Effect
�
Consumers
experience an increase in real
purchasing power when the
price of one
good
falls.
Substitution
Effect
The
substitution
effect is the
change in an item's consumption
associated with a
change
in the price of the item,
with the level of utility
held constant.
When the
price of an item declines,
the substitution effect
always leads to an
increase
in
the quantity of the item
demanded.
Income
Effect
The
income
effect is the
change in an item's consumption
brought about by the
increase
in purchasing power, with
the price of the item
held constant.
When a person's
income increases, the
quantity demanded for the
product may
increase
or decrease.
Even with
inferior goods, the income
effect is rarely large
enough to outweigh
the
substitution
effect.
Income
& Substitution Effects: Normal
Good
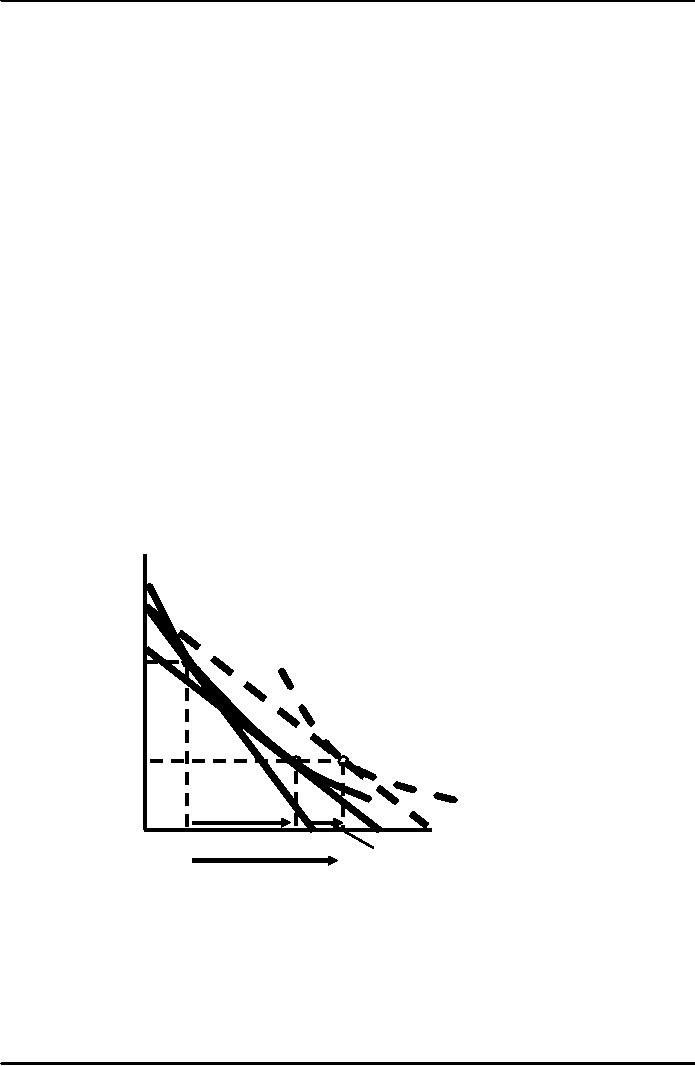
Clothing
When
the price of food
falls,
(units
per
consumption
increases by F1F2 as
month)
R
the
consumer moves from A to
B.
The
substitution effect,F1E,
(from
point A
to D),
changes
the
relative
prices but keeps real
income
C1
A
(satisfaction)
constant.
The
income effect, EF2,
(
from D
to
B)
keeps relative
prices
constant but
D
B
increases
purchasing power.
C2
U2
Substitution
U1
Effect
Food
(units
O
F1
E
S
F2
T
per
month)
Total
Effect
Income
Effect
52
Microeconomics
ECO402
VU
Clothing
(units
per
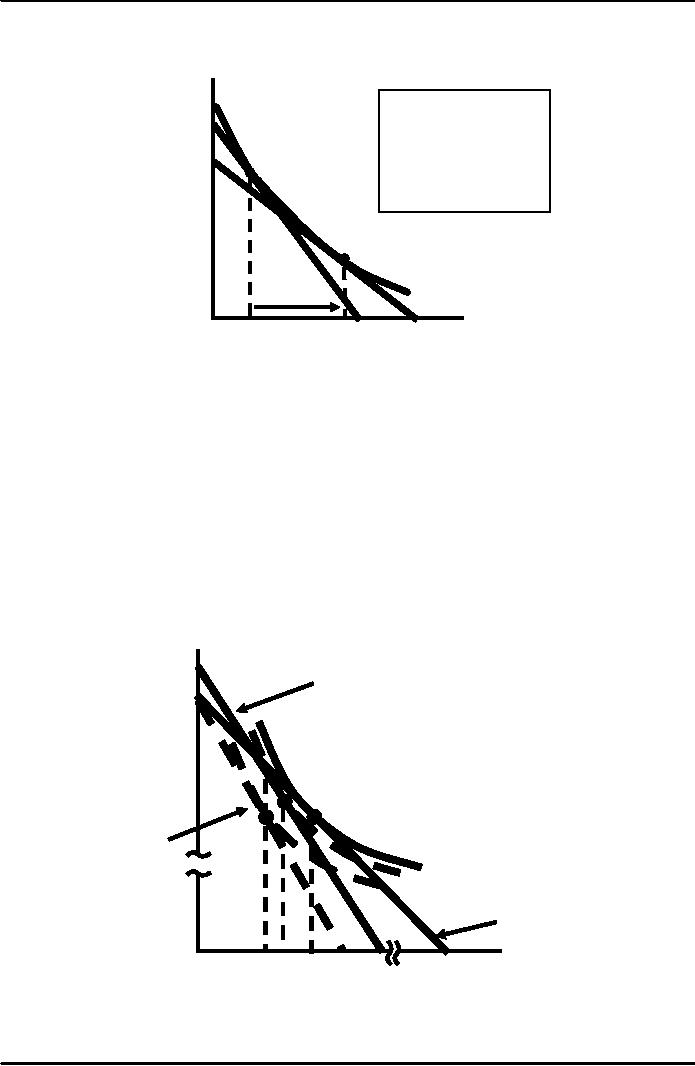
Since
food is an
inferior
good, the
month)
R
income
effect is
negative.
However,
the
substitution effect
A
is
larger than the
income
effect.
D
Substitution
Effect
U1
Food
(units
O
E S
T
F1
F2
per
month)
A
Special Case--The
Giffen Good
The
income effect may
theoretically be large enough to
cause the demand curve
for a
good
to slope upward.
This
rarely occurs and is of
little practical
interest.
Effect
of a Gasoline Tax with a
Rebate
Assume
Ped = -0.5
Income = $9,000
Price of
gasoline = $1
Expenditures
On
Other
After
Gasoline Tax
Goods
($)
F
Plus
Rebate
�
A
$.50
Excise Tax
�
Gasoline
= 900
�
$450
REBATE
�
New
budget line
H
C
After
Gasoline
= 1200 gallons
E
Other
expenditures = $7800
Gasoline
Tax
U2
U3
U1
Original
Budget
Line
Gasoline
Consumption
D
J
B
900
913.5 1200
(gallons/year)
53
Microeconomics
ECO402
VU
Market
Demand
Market
Demand Curves
A curve that
relates the quantity of a
good that all consumers in a
market buy to the
price
of that good.
Determining
the Market Demand
Curve
Price
Individual
A
Individual
B Individual C
Market
($)
(units)
(units)
(units)
(units)
1
6
10
16
32
2
4
8
13
25
3
2
6
10
18
4
0
4
7
11
5
0
2
4
6
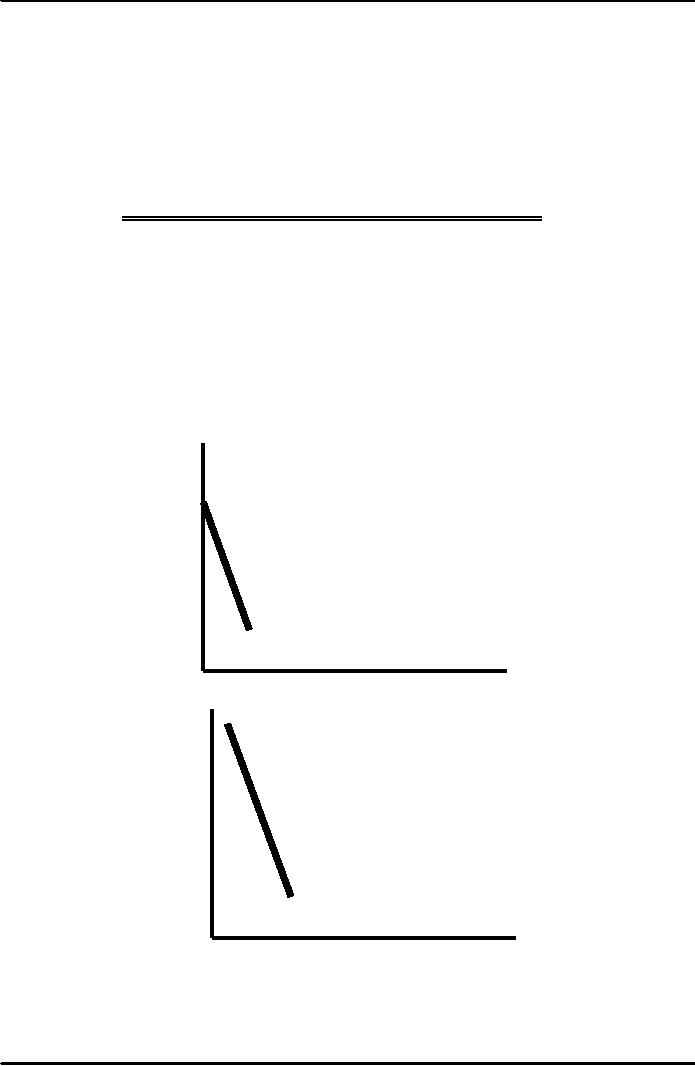
Summing
to Obtain a Market Demand
Curve
Price
5
4
3
2
1
DA
Quantity
0
5
10
15
20
25
30
Price
5
4
3
2
1
DB
Quantity
0
5
10
15
20
25
30
54
Microeconomics
ECO402
VU
Price
5
4
3
2
1
DC
Quantity
0
5
10
15
20
25
30
Price
5
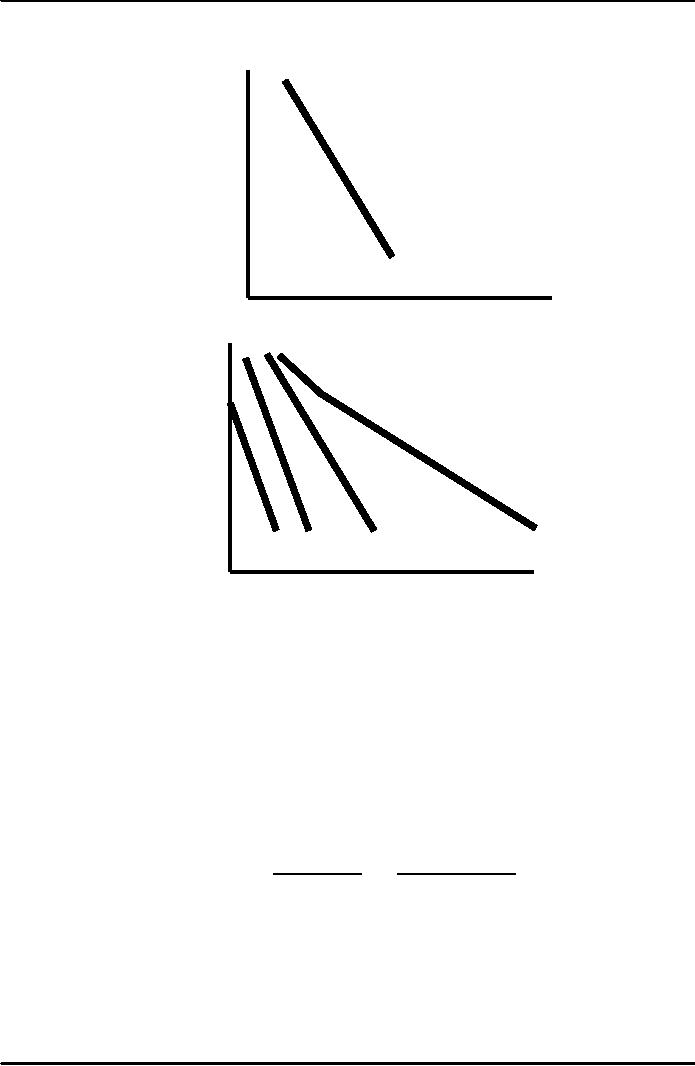
The
market demand
curve
is obtained by
summing
the consumer's
4
demand
curves
3
Market
Demand
2
1
DA
DB
DC
Quantity
0
5
10
15
20
25
30
Two
Important Points
1)
The market demand will
shift to the right as more
consumers enter
the
market.
2)
Factors that influence the
demands of many consumers
will also affect the
market
demand.
Elasticity
of Demand
Recall:
Price elasticity of demand
measures the percentage
change in the
quantity
demanded
resulting from a 1-percent
change in price.
Δ
Q/Q
ΔQ
/ ΔP
EP =
=
Δ
P/P
Q/P
55

Microeconomics
ECO402
VU
Price
Elasticity and Consumer
Expenditure
Demand
If
Price Increases,
If
Price Decreases,
Expenditures:
Expenditures:
Inelastic(Ep <1)
Increase
Decrease
Unit
Elastic (Ep =
1)
Are
unchanged
Are
unchanged
Elastic
(Ep >1)
Decrease
Increase
Point
Elasticity of Demand
For
large price changes (e.g.
20%), the value of
elasticity will depend upon
where the
price
and quantity lie on the
demand curve.
Point
elasticity measures elasticity at a
point on the demand
curve.
Its
formula is:
EP =
(P/Q)(1/slope)
Problems
Using Point
Elasticity
We
may need to calculate price
elasticity over portion of
the demand curve rather
than
at
a single point.
The price
and quantity used as the
base will alter the
price elasticity of
demand.
Point
Elasticity of Demand: An
Example
Assume
�
Price
increases from 8$ to $10
quantity demanded falls from
6 to 4
�
Percent
change in price equals:
$2/$8 = 25% or $2/$10 =
20%
�
Percent
change in quantity equals:
-2/6 = -33.33% or -2/4 =
-50%
Elasticity
equals:
-33.33/.25
= -1.33 or -.50/.20 =
-2.54
Which one is
correct?
Arc
Elasticity of Demand
Arc elasticity
calculates elasticity over a
range of prices
Its formula
is:
E
P =
(
Δ
Q/
Δ
P)(
P /
Q
)
P
=
the
averag e price
Q
=
the
averag e quantity
56

Microeconomics
ECO402
VU
Arc
Elasticity of Demand: An
Example
EP =
(
ΔQ/ΔP)(
P /
Q
)
P1 =
8,
P
2
=
10,
Q1 =
6,
Q
2
=
4
P
= 18 / 2
=
9
& Q
= 10 / 2
=
5
Ep = ( -2
/ $2)($9 / 5) =
-1.8
57
Table of Contents:
- ECONOMICS:Themes of Microeconomics, Theories and Models
- Economics: Another Perspective, Factors of Production
- REAL VERSUS NOMINAL PRICES:SUPPLY AND DEMAND, The Demand Curve
- Changes in Market Equilibrium:Market for College Education
- Elasticities of supply and demand:The Demand for Gasoline
- Consumer Behavior:Consumer Preferences, Indifference curves
- CONSUMER PREFERENCES:Budget Constraints, Consumer Choice
- Note it is repeated:Consumer Preferences, Revealed Preferences
- MARGINAL UTILITY AND CONSUMER CHOICE:COST-OF-LIVING INDEXES
- Review of Consumer Equilibrium:INDIVIDUAL DEMAND, An Inferior Good
- Income & Substitution Effects:Determining the Market Demand Curve
- The Aggregate Demand For Wheat:NETWORK EXTERNALITIES
- Describing Risk:Unequal Probability Outcomes
- PREFERENCES TOWARD RISK:Risk Premium, Indifference Curve
- PREFERENCES TOWARD RISK:Reducing Risk, The Demand for Risky Assets
- The Technology of Production:Production Function for Food
- Production with Two Variable Inputs:Returns to Scale
- Measuring Cost: Which Costs Matter?:Cost in the Short Run
- A Firm’s Short-Run Costs ($):The Effect of Effluent Fees on Firms’ Input Choices
- Cost in the Long Run:Long-Run Cost with Economies & Diseconomies of Scale
- Production with Two Outputs--Economies of Scope:Cubic Cost Function
- Perfectly Competitive Markets:Choosing Output in Short Run
- A Competitive Firm Incurring Losses:Industry Supply in Short Run
- Elasticity of Market Supply:Producer Surplus for a Market
- Elasticity of Market Supply:Long-Run Competitive Equilibrium
- Elasticity of Market Supply:The Industry’s Long-Run Supply Curve
- Elasticity of Market Supply:Welfare loss if price is held below market-clearing level
- Price Supports:Supply Restrictions, Import Quotas and Tariffs
- The Sugar Quota:The Impact of a Tax or Subsidy, Subsidy
- Perfect Competition:Total, Marginal, and Average Revenue
- Perfect Competition:Effect of Excise Tax on Monopolist
- Monopoly:Elasticity of Demand and Price Markup, Sources of Monopoly Power
- The Social Costs of Monopoly Power:Price Regulation, Monopsony
- Monopsony Power:Pricing With Market Power, Capturing Consumer Surplus
- Monopsony Power:THE ECONOMICS OF COUPONS AND REBATES
- Airline Fares:Elasticities of Demand for Air Travel, The Two-Part Tariff
- Bundling:Consumption Decisions When Products are Bundled
- Bundling:Mixed Versus Pure Bundling, Effects of Advertising
- MONOPOLISTIC COMPETITION:Monopolistic Competition in the Market for Colas and Coffee
- OLIGOPOLY:Duopoly Example, Price Competition
- Competition Versus Collusion:The Prisoners’ Dilemma, Implications of the Prisoners
- COMPETITIVE FACTOR MARKETS:Marginal Revenue Product
- Competitive Factor Markets:The Demand for Jet Fuel
- Equilibrium in a Competitive Factor Market:Labor Market Equilibrium
- Factor Markets with Monopoly Power:Monopoly Power of Sellers of Labor