 |
PERT / CPM:Expected time and Critical path |
| << PERT / CPM:Expected length of a critical path, Expected time and Critical path |
| PERT / CPM:RESOURCE SCHEDULING IN NETWORK >> |

Operations
Research (MTH601)
44
2
2
1
1
4
3
6
5
3
7
4
5
6
Expected
time and Critical
path.
Fig.
21
The
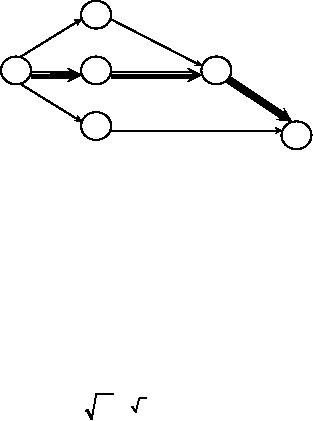
longest path is the critical
path and it consists of activities
1-3, 3-5 and 5-6
with a length Te =
4 + 6 + 7
=
17. The variance of the
critical path is then
VT =
Variance of 1-3 + variance of
3-5 + variance of
5-6.
VT = 1 + 4 + 4 = 9
Standard
deviation of duration of the
critical path
σ
= VT = 9
=
3
So
far what we have done with
PERT model is to recognize uncertainty by
using three time estimates
and
these
are reduced to a single time
estimate for finding the
critical path. It can be
used to find early
start-early finish
programme,
late start-late finish
programme and slack. The
variability of the time
estimates for each activity
is also
reduced
to a standard deviation and
variance and this is used to
find the standard deviation
of expected completion
time
for the project.
Probability
of completing a project with a
given date
One
may wonder how the
calculations made to find
Te,
ST and VT
are
useful to a project manager.
These
parameters
serve as a very useful tool
for a project manager to
estimate the probability of completing a
project with
a
given date.
We
have seen that the
time required for an
activity is uncertain and
hence it is a random variable.
Its
average
or expected value (te)
can be estimated on the
basis of an assumption regarding
the type of probability
distribution,
and three points on this
distribution namely optimistic, most
likely and pessimistic time
estimates.
We
estimate the average, or
expected, projected length,
Te by
adding the expected activity
durations along
the
critical path. As the te's
are all random variables,
then so is Te.
It is assumed that Te is to
follow approximately a
normal
distribution. This gives the probability of completing
a project with a given
date.
44

Operations
Research (MTH601)
45
Referring
to the example illustrated above,
the expected project length
is 17 days and a
standard
deviation
of 3 days. These are the
two parameters useful to
calculate the probability if the
due date is to be met.
For
example,
if the due date is T and
this is deviated from the
mean by T-Te and
the same can be expressed as
the ratio
of
standard deviation as
(T-Te)/S.D.
This is defined as the standard
normal variates denoted by
Z.
It
is known that in a normal distribution
the area under the
normal curve gives the
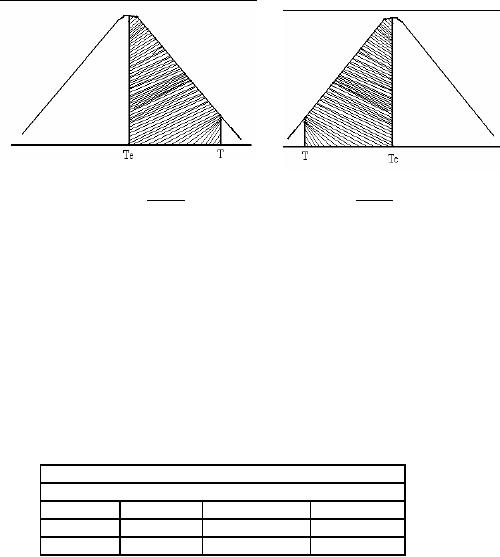
probability. For Z = 0, T
=
Te and
hence if the due date is
exactly the expected project
length, the probability of completing the
project is 50%
as
represented by the area to
the left of the central
line.
⎡T -
Te ⎤
⎡T -
Te ⎤
z=⎢
z=0
z=⎢
⎥
⎥
⎣ σ ⎦
⎣ σ ⎦
Fig.
22
Fig
23
If
in this example the due
date is 20 days, Z = (20 -
17)/3 = 1. For the value of
Z = 1 the area between Z =
0
and
Z = 1 is estimated (or as found
from the statistical tables)
as 0.3413. This is indicated in figure
222 by the
shaded
portion. Hence the probability of
completing the project in 20 days
will be 0.50 + 0.3413 =
0.8413 or
84.13%.
Similarly if the due date is
14 days, the corresponding
value of Z = - 1. For this
value of Z = -1 also, area
is
0.3413
but to the left of the
mean as indicated in figure
23.
The
probability of completing the project in 14
days will be =0.5000 -
0.3413 = 0.1587 or
15.87%.
Example
The
following table lists the
jobs of a network with their
time estimates.
Job
Duration
(days)
i-j
Optimistic
Most
likely
Pessimistic
1 2
3
6
15
1 6
2
5
14
2 3
6
12
30
45

Operations
Research (MTH601)
46
2 4
2
5
8
3 5
5
11
17
4 5
3
6
15
6 7
3
9
27
5 8
1
4
7
7 8
4
19
28
(a)
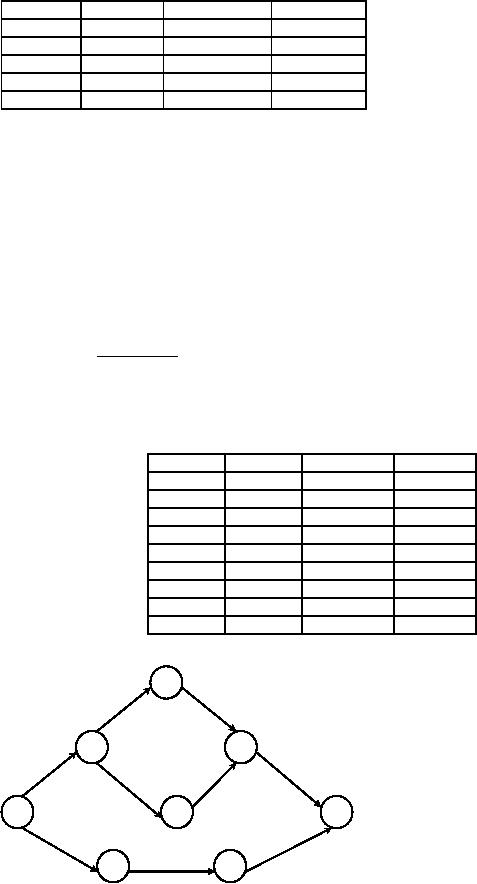
Draw
the project network.
(b)
Calculate
the length and variance of
the critical path.
(c)
What
the is approximate probability that
the jobs on the critical
path will be completed by
the due date of 42
days?
(d)
What
due date has about
90% chance of being
met?
Solution:
Before
proceeding to draw the project network,
let us calculate the expected
time of activity te,
standard
deviation
and variance of the expected
time of activity
using
(to + 4tm +
t
p )
te =
6
S.D =
(t
p -
to )
/ 6;
Variance
=
(S.D)2
Activity
te (Days)
S.D
(Days)
Variance
1-2
7
2
4
1-6
6
2
4
2-3
14
4
16
2-4
5
1
1
3-5
11
2
4
4-5
7
2
4
6-7
11
4
16
5-8
4
1
1
7-8
18
4
16
(a)
Project
Network:
3
14
11
2
5
7
5
7
4
1
4
8
46

Operations
Research (MTH601)
47
6
11
18
6
7
Expected
time and Critical
path
Fig.
24
(b)
There
are three paths:
1-2-3-5-8
= 36 days
1-2-4-5-8
= 23 days
1-6-7-8
=
35 days
1-2-3-5-8
is the longest path and
hence the critical
path.
Expected
length of the critical path
is 36 days. The variance for
1-2, 2-3, 3-5 and
5-8 are 4, 16, 4 and
1
respectively
and variance of the
projection duration is 25 and
hence
Standard
deviation of the project
duration = 25 = 5 days.
(c)
Due
date = 42 days (T)
Expected
duration = 36 days (Te)
and S.D = 5 days (o)
Z
=
(T -
Te ) /
S.D.
=
(42
-
36) /
5 =
1.2
The
area under the normal
curve for Z = 1.2 is
0.3849.
Therefore,
the probability of completing the project
in 42 days
=
0.5000 + 0.3849
=
0.8849
=
88.49%
Exercise
(1)
A
project has the following
characteristics:
Activity
Optimistic
time
Pessimistic
time
Most
likely time
1-2
1
5
1.5
2-3
1
3
2
2-4
1
5
3
3-5
3
5
4
4-5
2
4
3
4-6
3
7
5
5-7
4
6
5
6-7
6
8
7
7-8
2
6
4
47

Operations
Research (MTH601)
48
7-9
5
8
6
8-10
1
3
2
9-10
3
7
5
Construct
a network. Find the critical
path and variance for
each event. Find the
project duration at
95%
probability.
48
Table of Contents:
- Introduction:OR APPROACH TO PROBLEM SOLVING, Observation
- Introduction:Model Solution, Implementation of Results
- Introduction:USES OF OPERATIONS RESEARCH, Marketing, Personnel
- PERT / CPM:CONCEPT OF NETWORK, RULES FOR CONSTRUCTION OF NETWORK
- PERT / CPM:DUMMY ACTIVITIES, TO FIND THE CRITICAL PATH
- PERT / CPM:ALGORITHM FOR CRITICAL PATH, Free Slack
- PERT / CPM:Expected length of a critical path, Expected time and Critical path
- PERT / CPM:Expected time and Critical path
- PERT / CPM:RESOURCE SCHEDULING IN NETWORK
- PERT / CPM:Exercises
- Inventory Control:INVENTORY COSTS, INVENTORY MODELS (E.O.Q. MODELS)
- Inventory Control:Purchasing model with shortages
- Inventory Control:Manufacturing model with no shortages
- Inventory Control:Manufacturing model with shortages
- Inventory Control:ORDER QUANTITY WITH PRICE-BREAK
- Inventory Control:SOME DEFINITIONS, Computation of Safety Stock
- Linear Programming:Formulation of the Linear Programming Problem
- Linear Programming:Formulation of the Linear Programming Problem, Decision Variables
- Linear Programming:Model Constraints, Ingredients Mixing
- Linear Programming:VITAMIN CONTRIBUTION, Decision Variables
- Linear Programming:LINEAR PROGRAMMING PROBLEM
- Linear Programming:LIMITATIONS OF LINEAR PROGRAMMING
- Linear Programming:SOLUTION TO LINEAR PROGRAMMING PROBLEMS
- Linear Programming:SIMPLEX METHOD, Simplex Procedure
- Linear Programming:PRESENTATION IN TABULAR FORM - (SIMPLEX TABLE)
- Linear Programming:ARTIFICIAL VARIABLE TECHNIQUE
- Linear Programming:The Two Phase Method, First Iteration
- Linear Programming:VARIANTS OF THE SIMPLEX METHOD
- Linear Programming:Tie for the Leaving Basic Variable (Degeneracy)
- Linear Programming:Multiple or Alternative optimal Solutions
- Transportation Problems:TRANSPORTATION MODEL, Distribution centers
- Transportation Problems:FINDING AN INITIAL BASIC FEASIBLE SOLUTION
- Transportation Problems:MOVING TOWARDS OPTIMALITY
- Transportation Problems:DEGENERACY, Destination
- Transportation Problems:REVIEW QUESTIONS
- Assignment Problems:MATHEMATICAL FORMULATION OF THE PROBLEM
- Assignment Problems:SOLUTION OF AN ASSIGNMENT PROBLEM
- Queuing Theory:DEFINITION OF TERMS IN QUEUEING MODEL
- Queuing Theory:SINGLE-CHANNEL INFINITE-POPULATION MODEL
- Replacement Models:REPLACEMENT OF ITEMS WITH GRADUAL DETERIORATION
- Replacement Models:ITEMS DETERIORATING WITH TIME VALUE OF MONEY
- Dynamic Programming:FEATURES CHARECTERIZING DYNAMIC PROGRAMMING PROBLEMS
- Dynamic Programming:Analysis of the Result, One Stage Problem
- Miscellaneous:SEQUENCING, PROCESSING n JOBS THROUGH TWO MACHINES
- Miscellaneous:METHODS OF INTEGER PROGRAMMING SOLUTION