 |
PERT / CPM:DUMMY ACTIVITIES, TO FIND THE CRITICAL PATH |
| << PERT / CPM:CONCEPT OF NETWORK, RULES FOR CONSTRUCTION OF NETWORK |
| PERT / CPM:ALGORITHM FOR CRITICAL PATH, Free Slack >> |
Operations
Research (MTH601)
26
The
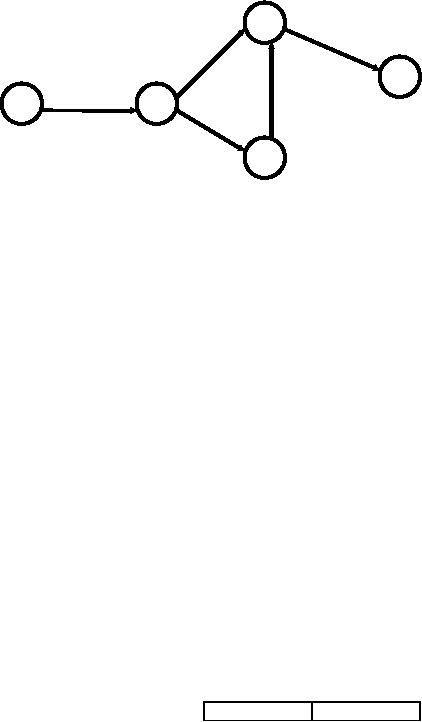
project of budgeting can be
displayed in a network or project graph
by an arrow diagram. Jobs
are
shown
as arrows leading from one
node to the other as in
Figure 2.
4
E
B
5
A
D
1
2
C
3
Fig.
2
From
the arrow diagram 2, we infer that
activity A is the first job.
Jobs B and C start only
after A is over. A is
called
the
predecessor of B and C and B
and C the successors of
A.
RULES
FOR CONSTRUCTION OF
NETWORK
(a)
Each
activity is represented by one
and only one arrow.
This means that no single
activity can be
represented
twice in a network.
(b)
No
two activities can be identified by the
same end events. This means
that there should not
be
loops
in the network.
(c)
Time
follows from left to right.
All the arrows point in one
direction. Arrows pointing in
opposite
direction
must be avoided.
(d)
Arrows
should not cross each
other.
(e)
Every
node must have at least
one activity preceding it
and at least one activity
following it,
except
for the nodes at the
very beginning and at the
very end of the
network.
DUMMY
ACTIVITIES
There
is a need for dummy activities
when the project contains
groups of two or more jobs
which have
common
predecessors. The time taken
for the dummy activities is
zero.
Suppose
we have the following
project of jobs with their
immediate predecessors.
Jobs
Immediate
26
Operations
Research (MTH601)
27
predecessors
A
-
B
-
C
-
D
A,
B
E
B,
C
Activity
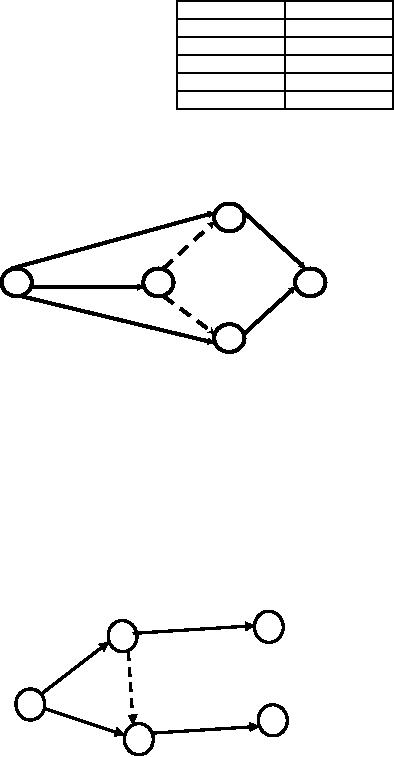
B is the common immediate predecessor of
both D and E. A is the immediate
predecessor of D
alone
and C is the predecessor of E. Let B
lead into two dummy
jobs D1 and
D2 and let D1
be an
immediate
predecessor
of D and D2 of
E as shown in Figure 3.
A
D
D1
B
E
D2
C
Fig.
3
Dummy
arrow represents an activity with
zero time duration. It is
represented by a dotted line
and is
introduced
in a network to clarify activity pattern
under the following
situations.
(i)
It is created to make activities with
common starting and
finishing events
distinguishable.
(ii)
To identify and maintain the
proper precedence relationship
between activities those are
not connected
by
events.
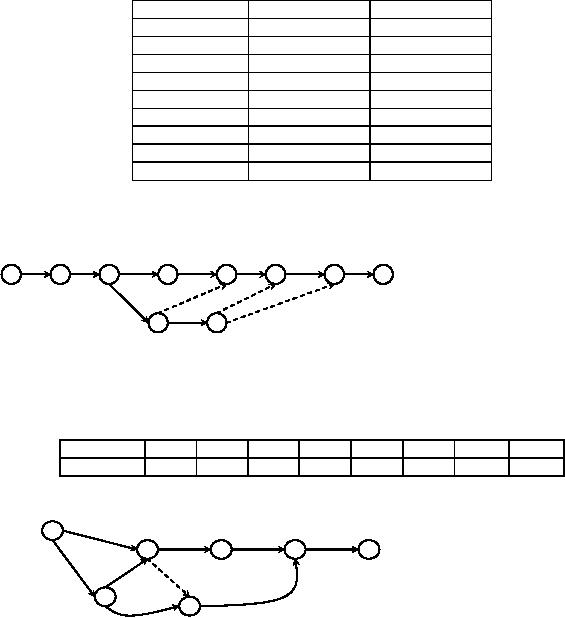
Consider
an example where A and B are
parallel (concurrent activities). C is
dependent on A and D is
dependent
on both A and B. Such a
situation can be represented
easily by use of dummy
activity as shown in
Figure
4.
C
2
4
A
D1
1
B
D
5
3
Fig.
4
27
Operations
Research (MTH601)
28
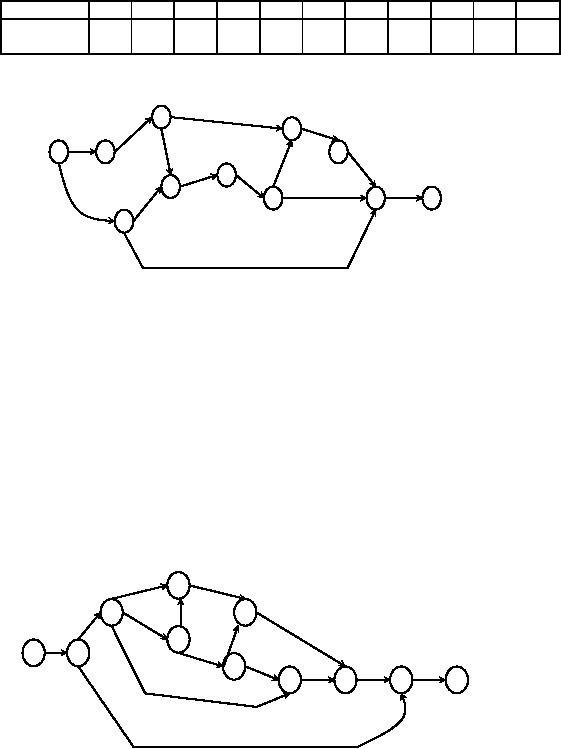
Example
2: A
project consists of the
following activities whose precedence
relationship is given below.
Draw an
arrow
diagram to represent the
project.
Activity
Followed
by
Preceded
by
A
B,
C
-
B
D
C,
A
C
E,
B
A
D
F
B
E
G,
F
C
F
H
E,
D
G
H,
I
E
H
I
G,
F
I
-
G,
H
Solution
A
C
B
D
F
H
I
D2
D1
E
D3
G
Fig.
5
Example
Consider
the following project. Draw
an arrow diagram to represent the
project.
Activity
A
B
C
D
F
G
H
I
Precedence
-
-
A
A
B,
C
F
B,C,D
H,G
Solution:
B
F
G
I
A
C
H
D
Fig.
6
Example
Consider
the project of building a
house. The details of the
project activities are tabulated
below. Draw
network.
28
Operations
Research (MTH601)
29
Activity
A
B
C
D
E
F
G
H
I
J
K
Immediate
Predecessor
-
A
-
B,C
C
G,H
D
B
F
G
E,I,J
Solution:
B
4
H
F
A
8
9
1
2
D2
I
D
6 G
D3
5
J
K
7
C
D1
10
11
3
E
Fig.
7
Example
A
project has the following
activities. The relationships among
the activities are given
below. Construct
the
network.
A
is the first
operation.
B
and C can be performed
parallel and are immediate
successors to A.
D,E
and F follow B.
G
follows E.
H
follows D, but it cannot
start till E is
complete.
I
and J succeed G.
F
and J precede K.
H
and I precede L.
M
succeeds L and K.
The
last operation N succeeds M
and C.
Solution:
D
5
H
3
E
7
B
4
I
L
1
2
6
J
M
N
F
8
9
10
11
K
Fig.
8
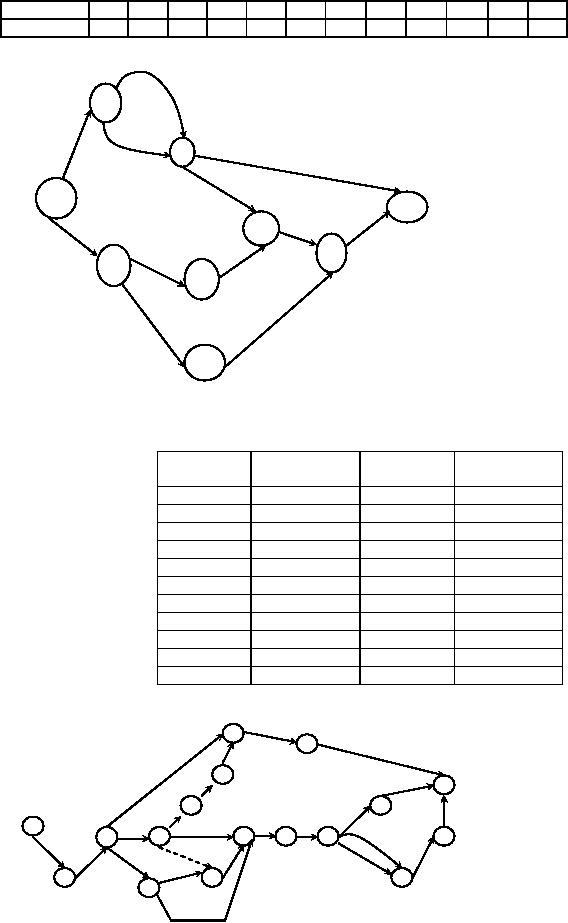
Example
29
Operations
Research (MTH601)
30
Activity
A
B
C
D
E
F
G
H
I
J
K
L
Predecessor
-
-
A
A
B
B
C,D
E
C,D
G,H
F
J,K
C
2
D
A
3
I
G
1
9
7
J
L
B
E
H
8
4
5
K
F
6
Fig.
9
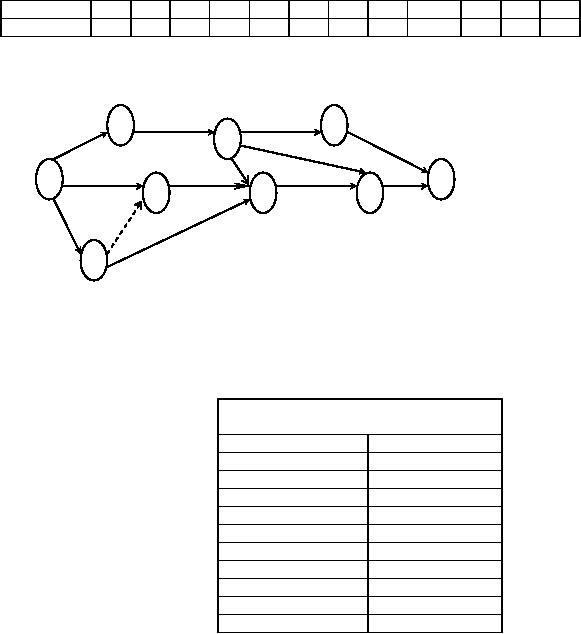
Example
Draw
network from the following
list of activities.
Job
Immediate
Job
Immediate
Name
predecessor
Name
predecessor
a
-
l
k
b
a
m
k
c
b
n
k
d
c
o
d
e
b
p
o
f
e
q
b
g
e
r
n
h
c
s
l,
m
i
c,
f
t
s
j
g,
h, i
u
p,
q
k
j
v
u
u
v
p
q
r
o
d
n
t
30
Operations
Research (MTH601)
31
c
h
1
a
i
j
k
b
f
m
s
g
Fig.
10
Example
For
a project of 12 activities the details
are given below. Draw PERT
network.
Activity
A
B
C
D
E
F
G
H
I
J
K
L
Dependence
-
-
-
B,C
A
C
E
E
D,F,H
E
I,J
G
Solution:
E
G
A
J
L
H
B
D
I
K
F
C
D1
Fig.
11
Exercises
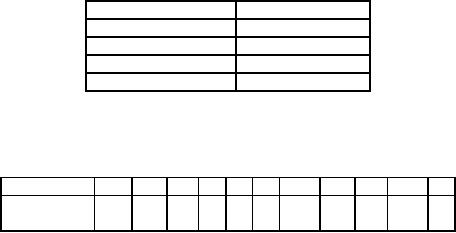
1.
(a)
Explain in brief PERT, CPM
and dummy activities with
reference to Project
Management.
(b)
The following information is known
for a project. Draw the
network and find the
critical path.
Capital
letters denote activities and
the numbers in bracket
denote activities' time.
This
must be
before
This
can
completed
start
A(30)
C
B(7)
D
B
G
B
K
C(10)
D
C
G
D(14)
E
E(10)
F
F(7)
H
F
I
F
L
31
Operations
Research (MTH601)
32
F
I
G(21)
L
H(7)
J(15)
I(12)
J
K(30)
L(15)
2.
Draw
network diagram for the
following activities whose predecessors
are given in the table
below.
Job
A
B
C
D
E
F
G
H
I
J
K
Immediate
Predecessors
-
A
B
C
B
E
D,F
E
H
G,I
J
TO
FIND THE CRITICAL PATH
After
listing all the activities
with their precedence
relationship we project these activities
in a project graph
represented
by arrows or Activity On Node
diagram (AON). Now we have
to find the minimum time
required for
completion
of the entire project. For
this we must find the
longest path with the
sequence of connected activities
through
the network. This is called the
critical path of the network
and its length determines
the time for
completion
of
the project. The activities in
the critical path are so
critical that, if they are
delayed, the project completion
date
cannot
be met and the project
finish time will have to be
extended. We shall now see
how to identify the
critical
path,
the critical activities and
the duration of the project.
The meaning of path and
length of a path should
first be
made
clear. Let us take following
example.
32
Operations
Research (MTH601)
33
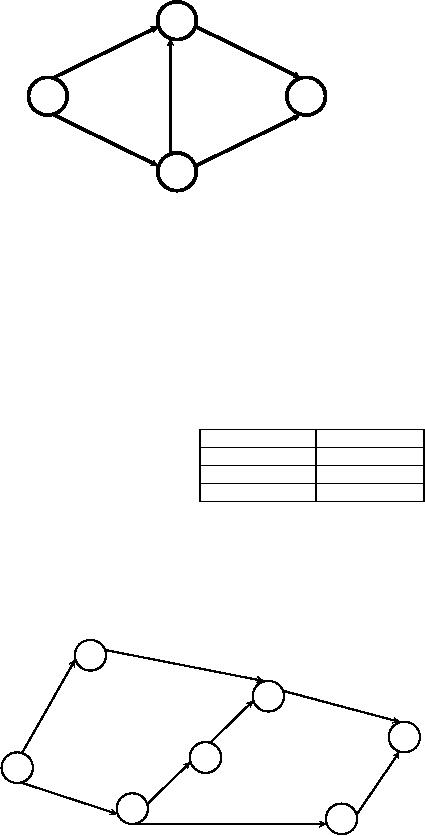
Consider
the following network shown in figure
12.
3
A
3
5
1
C7
4
B
E
6
6
2
Fig.
12
We
have five activities A, B, C, D and E
with the time of completion of
the activities 5, 6, 7, 3 and 6
days
respectively.
We represent the activities in a network
shown in the same
figure.
In
this network, there are three ways to
get from the starting point
at node 1 and travel through
the network
to
end at node 4. These ways
are called paths. Thus, a
path is defined as "a set of
nodes connected by lines
which
begin
at the initial node of a network
and end at the terminal
node". In figure12, there
are three paths namely,
1-3-4,
1-2-3-4
and 1-2-4 where the
numbers represent the nodes.
The length of a path in a network is
the total time it
takes
to
travel along the path. This
time is calculated by adding
the individual times between
the connected nodes on
the
path.
A path is called a critical
path if it is the longest
the path in a project network. We
have the times of the
three
distinct
paths has shown
below.
Path
Time
(days)
1-3-4
5
+ 3 = 8 days
1-2-3-4
6
+ 7 + 3 = 16
1-2-4
6
+ 6 = 12
The
path connecting the nodes
1,2,3 and 4 constitutes the
longest path and hence
1-2-3-4 is the critical
path.
The
minimum time to complete the
project is the time taken
for the longest path
namely 16 days. The activities B
(1-
2),
C (2-3) and D(3-4) constitute
the critical activities. These
jobs are critical in
determining the project's
duration.
The
critical path for the
above example can be shown
in the diagram.
The
same can be calculated using
Activity On Node diagram.
The AON diagram is as shown
in figure 13.
A,5
D,3
End
C,7
33
Table of Contents:
- Introduction:OR APPROACH TO PROBLEM SOLVING, Observation
- Introduction:Model Solution, Implementation of Results
- Introduction:USES OF OPERATIONS RESEARCH, Marketing, Personnel
- PERT / CPM:CONCEPT OF NETWORK, RULES FOR CONSTRUCTION OF NETWORK
- PERT / CPM:DUMMY ACTIVITIES, TO FIND THE CRITICAL PATH
- PERT / CPM:ALGORITHM FOR CRITICAL PATH, Free Slack
- PERT / CPM:Expected length of a critical path, Expected time and Critical path
- PERT / CPM:Expected time and Critical path
- PERT / CPM:RESOURCE SCHEDULING IN NETWORK
- PERT / CPM:Exercises
- Inventory Control:INVENTORY COSTS, INVENTORY MODELS (E.O.Q. MODELS)
- Inventory Control:Purchasing model with shortages
- Inventory Control:Manufacturing model with no shortages
- Inventory Control:Manufacturing model with shortages
- Inventory Control:ORDER QUANTITY WITH PRICE-BREAK
- Inventory Control:SOME DEFINITIONS, Computation of Safety Stock
- Linear Programming:Formulation of the Linear Programming Problem
- Linear Programming:Formulation of the Linear Programming Problem, Decision Variables
- Linear Programming:Model Constraints, Ingredients Mixing
- Linear Programming:VITAMIN CONTRIBUTION, Decision Variables
- Linear Programming:LINEAR PROGRAMMING PROBLEM
- Linear Programming:LIMITATIONS OF LINEAR PROGRAMMING
- Linear Programming:SOLUTION TO LINEAR PROGRAMMING PROBLEMS
- Linear Programming:SIMPLEX METHOD, Simplex Procedure
- Linear Programming:PRESENTATION IN TABULAR FORM - (SIMPLEX TABLE)
- Linear Programming:ARTIFICIAL VARIABLE TECHNIQUE
- Linear Programming:The Two Phase Method, First Iteration
- Linear Programming:VARIANTS OF THE SIMPLEX METHOD
- Linear Programming:Tie for the Leaving Basic Variable (Degeneracy)
- Linear Programming:Multiple or Alternative optimal Solutions
- Transportation Problems:TRANSPORTATION MODEL, Distribution centers
- Transportation Problems:FINDING AN INITIAL BASIC FEASIBLE SOLUTION
- Transportation Problems:MOVING TOWARDS OPTIMALITY
- Transportation Problems:DEGENERACY, Destination
- Transportation Problems:REVIEW QUESTIONS
- Assignment Problems:MATHEMATICAL FORMULATION OF THE PROBLEM
- Assignment Problems:SOLUTION OF AN ASSIGNMENT PROBLEM
- Queuing Theory:DEFINITION OF TERMS IN QUEUEING MODEL
- Queuing Theory:SINGLE-CHANNEL INFINITE-POPULATION MODEL
- Replacement Models:REPLACEMENT OF ITEMS WITH GRADUAL DETERIORATION
- Replacement Models:ITEMS DETERIORATING WITH TIME VALUE OF MONEY
- Dynamic Programming:FEATURES CHARECTERIZING DYNAMIC PROGRAMMING PROBLEMS
- Dynamic Programming:Analysis of the Result, One Stage Problem
- Miscellaneous:SEQUENCING, PROCESSING n JOBS THROUGH TWO MACHINES
- Miscellaneous:METHODS OF INTEGER PROGRAMMING SOLUTION