 |
Contents of Project Reports |
| << Course Project |
| Case Study: Agri-Data Warehouse >> |

In the
context of sales and
marketing, a prospect is someone
who can become a customer.
A
customer is
someone who will buy a product or
service form you. So every
sales person is
looking
for a customer or wants to convert a
prospect into a customer.
However, on an average
10% of
the prospects become a
customer, it means if you try 10
prospects, in the worst case
the
last
one will be the customer.
Look at positively, meaning
the more failures you have, the
more
close
you get to your customer.
This is why the saying
goes that "quitters never
win, and winners
never
quit". Similarly look at the
work of Thomas Edison, he
kept trying and untimely
become
immortal
i.e. his name still
lives and his invention
still used.
What if
you are never
entertained?
It may so
happen that no one ente
rtains/helps you, maybe you
did not tried hard, maybe
you had
the
wrong attitude, maybe you
did not meet the right
people , maybe you were not
very
convincing ,
maybe the end user
was apprehensive etc.
Upto
10% less credit if this
approach is adopted
In such a
case, search the web, read
books/magazines and pick any
one of the 5 types of
organizations
discussed and collect
reference/related material (not beyond
year 2000).
Use
the material collected to
write reports 2 to 6.
Now it
may so happen, that you tried,
and tried and tried
very hard, but still
unable to get a key
person
interested and willing to help you so
that you could write to write report_2.
There could be
several reasons
for this, maybe you don't
tried hard, maybe it was
because of the other person
etc.
In such a
case, you will do a lifecycle
case study using the
Internet. In report_2 you will list
all
the
reasons for failure and
how you tried, and then we
will decide about how
much credit to
deduct
from the semester project.
The amount of deduction could be upto
10%. But you still
have
to write
all the reports and
use the material from the
case studies tailored to the
requirements of
the
reports. For this purpose
you will have to download a number of
focused case studies, better
if
about the
same organization, and compile
the results in the form of
the reports as per the
Ralph
Kimball's
road map.
Contents of
Project Reports
The project
reports to include, but is not limited
to, the following:
�
Narrative
summary of results produced
(report_1).
�
Listings of
computer models/programs coded
and utilized (report_1).
�
Reports
displaying results (report_1).
�
System
usage instructions (report_1).
�
Narrative
description of business and tables of
appropriate data
(report_4).
�
Descriptions of
decisions to be supported by information
produced by
system
(report_4).
314

�
Structure
charts, dataflow diagrams and/or other
diagrams to document
the
structure of the system
(report 4-7).
�
Recommendations
(reports 5-7)
This is self
explanatory, and I have also
explained in the lecture.
Follow the guidelines to
the
word, as
your work will be graded
based on these guidelines. Note
that system usage
instructions
have to be
specific with screen shots of
the application developed, so that your
applications can
be executed
using the instructions and graded.
Don't forget to submit the
entire source code,
along with
the compiled code with all
necessary libraries DLLs
attached.
Format of
Project Reports:
Main
�
Report
No.
�
Title of
course, semester & submission
date
�
Names
and roll no. of project
members.
�
Campus
and name of city.
�
Table of
contents.
�
1-page executive
summary for each
report.
�
Attach
(scanned) hard/soft copies of all
related material collected and
referenced with
each
report.
�
At the
end of semester, combine ALL
reports and submit as a
single report.
Again
this is self explanatory, and I
have also explained in the
lecture. Follow the guidelines
to
the
word, as your work will be
graded based on these
guidelines.
Format of
Project Reports: Other
�
No spelling or
grammar mistakes.
�
Make sections
and number them (as per
contents of report discussed).
�
Pages
should be numbered (bottom
center).
�
Add an
index at the end of
report.
�
File
name:
RPT_no_semester_campus_rollno_CS614.doc
�
e.g.
RPT_1_F05_BestComputersWah_234,235_CS614.doc
�
Email
copy of report.
�
Warning:
Do not
copy-paste, I can and I will
catch you.
MS Word
has a facility to create an index.
You begin by creating a file
with a list of keywords to
be listed in
the index, and then go to
Insert then Reference then In
dex and Tables,
press
AutoMark
and select the file
with keywords.
315

The naming
convention of the reports is important,
so that your reports can be
easily identified as
there
are about half a dozen
reports for each group. The
following convention to be used in
report
naming:
RPT:
This
will be repeated for each
report and will not
change.
no:
is
the report number i.e. 1 through 7
semester:
is
the semester, some possible
semesters are F05 i.e.
Fall 2005 or SP06 i.e.
Spring
2006 or SPL05
i.e. special semester 2005
or SM06 i.e. summer
2006.
campus:
The
name of the VU campus where you
are registered or taking the
course along with
the
name of the city or town.
Write full name of the
campus, do not use underscore
i.e. _ or
dashes or
space in the campus
name.
rollno: Since it is a
group project, so roll numbers of
students in the group
separated by a comma.
CS614:
This
will be at the end of every
file name i.e. the
course code.
Don't
try to copy -paste or use
someone else's work with
your name, there are
smart tools to catch
this,
once you are caught, this
can result into zero
credit.
Why
would companies entertain
you?
�
You
are students, and whom you
meet were also once
students.
�
You
can do an assessment of the
company for DWH potential at no
cost.
�
Since you
are only interested in your
project, so your analysis
will be neutral.
�
Your report
can form a basis for a
professional detailed assessment at a
later stage.
�
If a DWH
already exists, you can do an
independent audit.
If you present
your case well you are
likely to be entertained i.e. welcome by
the organization.
The
first and the foremost
reason to get help is, whom
you are talking to was once
a student too
as you are
currently, so there is a common bond.
Since you have studied well
DWH (hopefully),
therefore, you
can do a requirement assessment (in
the form of lifecycle study)
of the company at
no cost;
the company has nothing to
lose. Your only interest is
completion of your project and
grade, so you
are going to be very
objective and very neutra l;
hence the company has
still nothing
to lose.
After you have done
the lifecycle study, the
same can be used as a seed
or input by a
professional
organization for an in depth study,
thus saving in money to the
company for which
you
have done the work.
Again the company has
nothing to lose. It may so
happen that the
company you
contact already has a data
warehouse in place, in such a
case doing the
lifecycle
development
study can be used as a internal audit of
the DWH implementation.
Hence in short, if
the
company allows and helps you
with the study, it will be a
win -win scenario for both
the
parties.
Why
you may be
entertained?
316

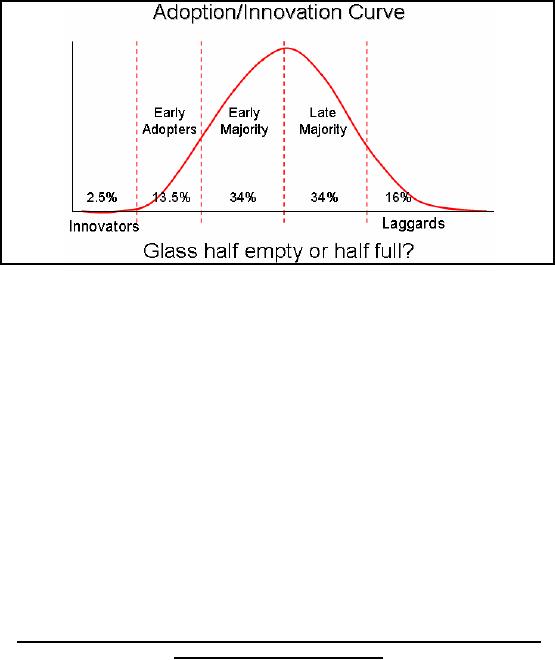
Figure-36.1:
Adoption/Innovation curve
Fig-36.1
shows a typical adoption curve when a
new item, product or service is
introduced and
the
ratio of people responding to it. As you
can see the people who
are the first ones to
adopt or
embrace it
are the innovators, and they
are very few. This is
followed by early adopters, which
is
a sizeable
figure, and this is the
category of companies you
are supposed to target as part of
your
project. Note
that in our country, Data
Warehousing is not yet in
the category of early majority,
so there
will be more companies who
are prime candidates for
lifecycle study. You may
also
come
across people who may be
genuinely interested in a DWH, but don't
know enough about
it,
and want to
know. In such a case, be prepared to
educate them or enlighten them. It
would be best
if you look at a
number of case studies or reports
about their line of business
before meeting
them.
Interestingly,
the bell shaped curve
(which is not a perfect bell) divides
the prospects into
two
equal
parts i.e. 50% each.
You should be looking at that
50% which can and
will help you,
instead of
those who are likely to help
you, but at a later stage.
Finally
this project has enough
challenges to become your
final year BSc project. In
such a case
be prepared to
do coding leading to system deployment
and completion of all the remaining
steps.
Remember,
many large organizations/businesses
may not need a data
warehouse today, but
they
will
need one surely tomorrow.
And when that happens, they
will be looking for you to help
them
achieve
their objectives.
The project
has more than enough
potential to become a final year project,
which will cover an
implementation
and deployment also.
317
Table of Contents:
- Need of Data Warehousing
- Why a DWH, Warehousing
- The Basic Concept of Data Warehousing
- Classical SDLC and DWH SDLC, CLDS, Online Transaction Processing
- Types of Data Warehouses: Financial, Telecommunication, Insurance, Human Resource
- Normalization: Anomalies, 1NF, 2NF, INSERT, UPDATE, DELETE
- De-Normalization: Balance between Normalization and De-Normalization
- DeNormalization Techniques: Splitting Tables, Horizontal splitting, Vertical Splitting, Pre-Joining Tables, Adding Redundant Columns, Derived Attributes
- Issues of De-Normalization: Storage, Performance, Maintenance, Ease-of-use
- Online Analytical Processing OLAP: DWH and OLAP, OLTP
- OLAP Implementations: MOLAP, ROLAP, HOLAP, DOLAP
- ROLAP: Relational Database, ROLAP cube, Issues
- Dimensional Modeling DM: ER modeling, The Paradox, ER vs. DM,
- Process of Dimensional Modeling: Four Step: Choose Business Process, Grain, Facts, Dimensions
- Issues of Dimensional Modeling: Additive vs Non-Additive facts, Classification of Aggregation Functions
- Extract Transform Load ETL: ETL Cycle, Processing, Data Extraction, Data Transformation
- Issues of ETL: Diversity in source systems and platforms
- Issues of ETL: legacy data, Web scrapping, data quality, ETL vs ELT
- ETL Detail: Data Cleansing: data scrubbing, Dirty Data, Lexical Errors, Irregularities, Integrity Constraint Violation, Duplication
- Data Duplication Elimination and BSN Method: Record linkage, Merge, purge, Entity reconciliation, List washing and data cleansing
- Introduction to Data Quality Management: Intrinsic, Realistic, Orr’s Laws of Data Quality, TQM
- DQM: Quantifying Data Quality: Free-of-error, Completeness, Consistency, Ratios
- Total DQM: TDQM in a DWH, Data Quality Management Process
- Need for Speed: Parallelism: Scalability, Terminology, Parallelization OLTP Vs DSS
- Need for Speed: Hardware Techniques: Data Parallelism Concept
- Conventional Indexing Techniques: Concept, Goals, Dense Index, Sparse Index
- Special Indexing Techniques: Inverted, Bit map, Cluster, Join indexes
- Join Techniques: Nested loop, Sort Merge, Hash based join
- Data mining (DM): Knowledge Discovery in Databases KDD
- Data Mining: CLASSIFICATION, ESTIMATION, PREDICTION, CLUSTERING,
- Data Structures, types of Data Mining, Min-Max Distance, One-way, K-Means Clustering
- DWH Lifecycle: Data-Driven, Goal-Driven, User-Driven Methodologies
- DWH Implementation: Goal Driven Approach
- DWH Implementation: Goal Driven Approach
- DWH Life Cycle: Pitfalls, Mistakes, Tips
- Course Project
- Contents of Project Reports
- Case Study: Agri-Data Warehouse
- Web Warehousing: Drawbacks of traditional web sear ches, web search, Web traffic record: Log files
- Web Warehousing: Issues, Time-contiguous Log Entries, Transient Cookies, SSL, session ID Ping-pong, Persistent Cookies
- Data Transfer Service (DTS)
- Lab Data Set: Multi -Campus University
- Extracting Data Using Wizard
- Data Profiling