 |
STATISTICAL PROCESS CONTROL (SPC) FOR CONTINUAL QUALITY IMPROVEMENT |
| << CAUSE AND EFFECT DIAGRAM AND OTHER TOOLS OF QUALITY:Control Charts |
| STATISTICAL PROCESS CONTROL….CONTD:Control Charts >> |

Total
Quality Management
MGT510
VU
Lesson
# 39
STATISTICAL
PROCESS CONTROL (SPC) FOR
CONTINUAL QUALITY
IMPROVEMENT
Variation
and Process
Control
In
a total quality setting,
consistency and predictability
are important. When a
process runs
consistently,
efforts
can begin to improve it by
reducing process variations, of
which there are two
kinds:
�
Common-cause
variation is the result of the sum of
numerous small sources of
natural variation
that
are always part of the
process.
�
Special-cause
variation is the result of factors that
are not part of the process
and that occur
only
in
special circumstances, such as a shipment of
faulty raw material or the
involvement of anew,
untrained
operator.
The
performance of a process that operates
consistently can be recorded and plotted
on a control chart
such
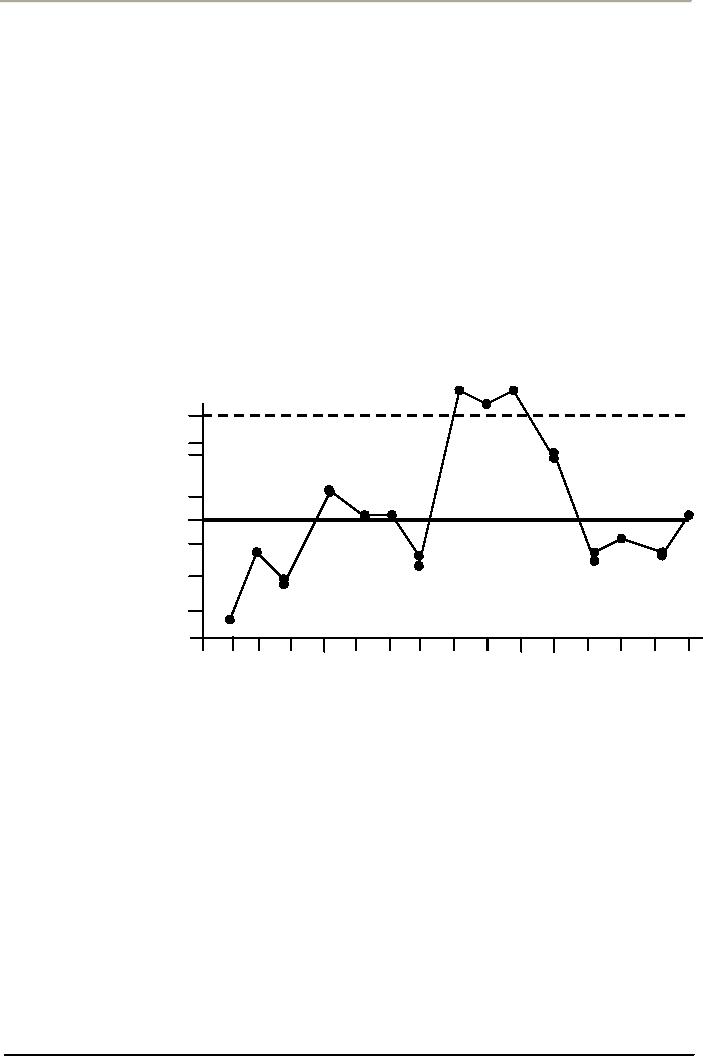
as the one in Figure below. The
sources of the variation in this
figure that fall within the
control
limits
are likely to be common causes.
The sources of variation in
this figure that fall
outside the control
limits
are likely to be special-causes
sources. In making decisions about the
process in question, it is
important
to separate common and special causes of
variation.
16
14
12
10
8
6
4
2
0
0
1
2
34
5
6
7
8
9
10
11
12
13
14
15
Control
Chart
If
you react to common-cause
variation as if it were due to special causes,
you will only make
matters
worse
and increase variation,
defects, and mistakes. If you
fail to notice the appearance of a
special
cause,
you will miss an opportunity
to search out and eliminate a
source of problems
Control
charting in SPC utilizes
in-process (sometimes called
on-line) sampling techniques to
help
monitor
a process. The purpose is to
indicate when the process is
functioning as intended
i.e.
statistically
under control and when to
take corrective action of
some type is necessary. Hence
SPC can
be
taken as a proactive and preventive
approach of quality improvement. An
in-control process is
considered
stable and out-of-control process is said
to be un-stable. Improvement in stable
system can
occur
only through system changes,
which are the responsibility of
management and empowered
employees.
Instability is created when a special
cause or disturbance is present. Once an
indication of a
process
shift is detected it is up to the operators,
engineers, and other technical people to
locate the
special
cause/s and take corrective
action.
163
Table of Contents:
- OVERVIEW OF QUALITY MANAGEMENT:PROFESSIONAL MANAGERIAL ERA (1950)
- TOTAL QUALITY MANAGEMENT AND TOTAL ORGANIZATION EXCELLENCE:Measurement
- INTEGRATING PEOPLE AND PERFORMANCE THROUGH QUALITY MANAGEMENT
- FUNDAMENTALS OF TOTAL QUALITY AND RATERS VIEW:The Concept of Quality
- TOTAL QUALITY MANAGEMENT AND GLOBAL COMPETITIVE ADVANTAGE:Customer Focus
- TOTAL QUALITY MANAGEMENT AND PLANNING FOR QUALITY AT OFFICE
- LEADERS IN QUALITY REVOLUTION AND DEFINING FOR QUALITY:User-Based
- TAGUCHI LOSS FUNCTION AND QUALITY MANAGEMENT
- WTO, SHIFTING FOCUS OF CORPORATE CULTURE AND ORGANIZATIONAL MODEL OF MANAGEMENT
- HISTORY OF QUALITY MANAGEMENT PARADIGMS
- DEFINING QUALITY, QUALITY MANAGEMENT AND LINKS WITH PROFITABILITY
- LEARNING ABOUT QUALITY AND APPROACHES FROM QUALITY PHILOSOPHIES
- TOTAL QUALITY MANAGEMENT THEORIES EDWARD DEMING’S SYSTEM OF PROFOUND KNOWLEDGE
- DEMING’S PHILOSOPHY AND 14 POINTS FOR MANAGEMENT:The cost of quality
- DEMING CYCLE AND QUALITY TRILOGY:Juran’s Three Basic Steps to Progress
- JURAN AND CROSBY ON QUALITY AND QUALITY IS FREE:Quality Planning
- CROSBY’S CONCEPT OF COST OF QUALITY:Cost of Quality Attitude
- COSTS OF QUALITY AND RETURN ON QUALITY:Total Quality Costs
- OVERVIEW OF TOTAL QUALITY APPROACHES:The Future of Quality Management
- BUSINESS EXCELLENCE MODELS:Excellence in all functions
- DESIGNING ORGANIZATIONS FOR QUALITY:Customer focus, Leadership
- DEVELOPING ISO QMS FOR CERTIFICATION:Process approach
- ISO 9001(2000) QMS MANAGEMENT RESPONSIBILITY:Issues to be Considered
- ISO 9001(2000) QMS (CLAUSE # 6) RESOURCES MANAGEMENT:Training and Awareness
- ISO 9001(2000) (CLAUSE # 7) PRODUCT REALIZATION AND CUSTOMER RELATED PROCESSES
- ISO 9001(2000) QMS (CLAUSE # 7) CONTROL OF PRODUCTION AND SERVICES
- ISO 9001(2000) QMS (CLAUSE # 8) MEASUREMENT, ANALYSIS, AND IMPROVEMENT
- QUALITY IN SOFTWARE SECTOR AND MATURITY LEVELS:Structure of CMM
- INSTALLING AN ISO -9001 QM SYSTEM:Implementation, Audit and Registration
- CREATING BUSINESS EXCELLENCE:Elements of a Total Quality Culture
- CREATING QUALITY AT STRATEGIC, TACTICAL AND OPERATIONAL LEVEL
- BIG Q AND SMALL q LEADERSHIP FOR QUALITY:The roles of a Quality Leader
- STRATEGIC PLANNING FOR QUALITY AND ADVANCED QUALITY MANAGEMENT TOOLS
- HOSHIN KANRI AND STRATEGIC POLICY DEPLOYMENT:Senior Management
- QUALITY FUNCTION DEPLOYMENT (QFD) AND OTHER TOOLS FOR IMPLEMENTATION
- BASIC SQC IMPROVEMENT TOOLS:TOTAL QUALITY TOOLS DEFINED
- HOW QUALITY IS IMPLEMENTED? A DIALOGUE WITH A QUALITY MANAGER!
- CAUSE AND EFFECT DIAGRAM AND OTHER TOOLS OF QUALITY:Control Charts
- STATISTICAL PROCESS CONTROL (SPC) FOR CONTINUAL QUALITY IMPROVEMENT
- STATISTICAL PROCESS CONTROL….CONTD:Control Charts
- BUILDING QUALITY THROUGH SPC:Types of Data, Defining Process Capability
- AN INTERVIEW SESSION WITH OFFICERS OF A CMMI LEVEL 5 QUALITY IT PAKISTANI COMPANY
- TEAMWORK CULTURE FOR TQM:Steering Committees, Natural Work Teams
- UNDERSTANDING EMPOWERMENT FOR TQ AND CUSTOMER-SUPPLIER RELATIONSHIP
- CSR, INNOVATION, KNOWLEDGE MANAGEMENT AND INTRODUCING LEARNING ORGANIZATION