 |

Project
Management MGMT627
VU
LESSON
29
NETWORK
SCHEDULING TECHNIQUES
BROAD
CONTENTS
Slack
Terminology
Slack
Time Calculation
Slack
Identification
Network
Re-planning
29.1
Slack
Terminology:
Slack
can be defined as the difference between
the latest allowable date and the
earliest
expected
data based on the nomenclature
below:
TE
=
the earliest time (date) on which an
event can be expected to take
place
TL
=
the latest date on which an event
can take place without
extending the completion date
of
the
project
Slack
time = TL
TE
29.2
Slack
Time Calculation:
As
shown in Figure 29.1 below, the
calculation for slack time is
performed for each event in
the
network,
by identifying the earliest expected date
and the latest starting date.
For event 1, TL
TE
=
0. Event 1 serves as the reference point
for the network and could
just as easily have
been
defined
as a calendar date. As before, the
critical path is represented as a
bold line. The
events
on
the critical path have no slack (i.e.,
TL
=
TE)
and provide the boundaries for the
non-critical
path
events. Since event 2 is critical,
TL
=
TE
�
3 + 7 = 10 for event 5. Event 6
terminates the
critical
path with a completion time
of fifteen weeks.
The
earliest time for event 3,
which is not on the critical
path, would be two weeks
(TE
=
0 + 2
=
2), assuming that it started
as early as possible. The latest
allowable date is obtained
by
subtracting
the time required to complete the
activity from events 3 to 5
from the latest starting
date
of event 5.
Figure
29.1: PERT
Network with Slack
Time
Therefore,
TL
(for
event 3) = 10 5 = 5 weeks. Event 3
can now occur anywhere
between
weeks
2 and 5 without interfering with the
scheduled completion date of the
project. This same
procedure
can be applied to event 4, in
which case TE
=
6 and TL
=
9.
205
Project
Management MGMT627
VU
The
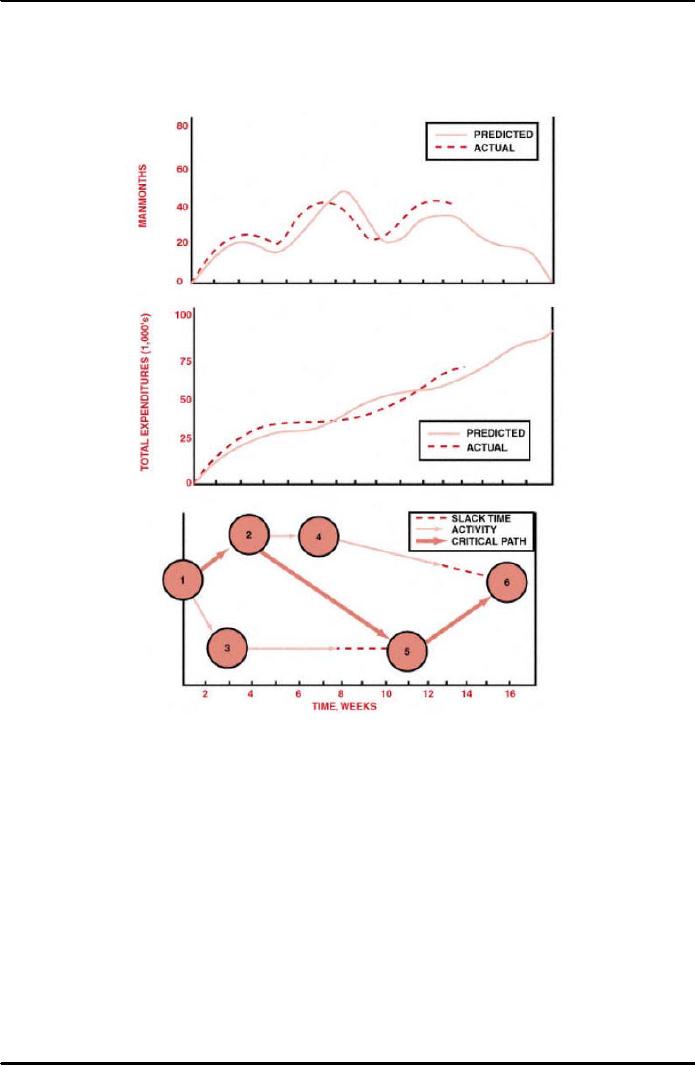
same figure 29.1 contains a
simple PERT network, and
therefore the calculation of slack
time
is not too difficult. For
complex networks containing
multiple paths, the earliest
starting
dates
must be found by proceeding
from start to finish through
the network, while the latest
allowable
starting date must be calculated by
working backward from finish
to start.
Figure
29.2: Comparison
Models for a Time- Phase
PERT Chart
We
must understand that the importance of
knowing exactly where the slack exists cannot
be
overstated.
Proper use of slack time permits better
technical performance. Donald Marquis
has
observed
that those companies making
proper use of slack time were 30 percent
more
successful
than the average in completing
technical requirements.
PERT
networks are often not
plotted with a time scale,
because of these slack times.
Planning
requirements,
however, can require that
PERT charts be reconstructed with time
scales, in
which
case a decision must be made
as to whether we wish early or
late time requirements
for
slack
variables. This is shown in Figure
29.2 above for comparison with
total program costs
and
manpower
planning. Early time requirements
for slack variables are
utilized in this
figure.
Note
that the earliest times and late times
can be combined to determine the
probability of
successfully
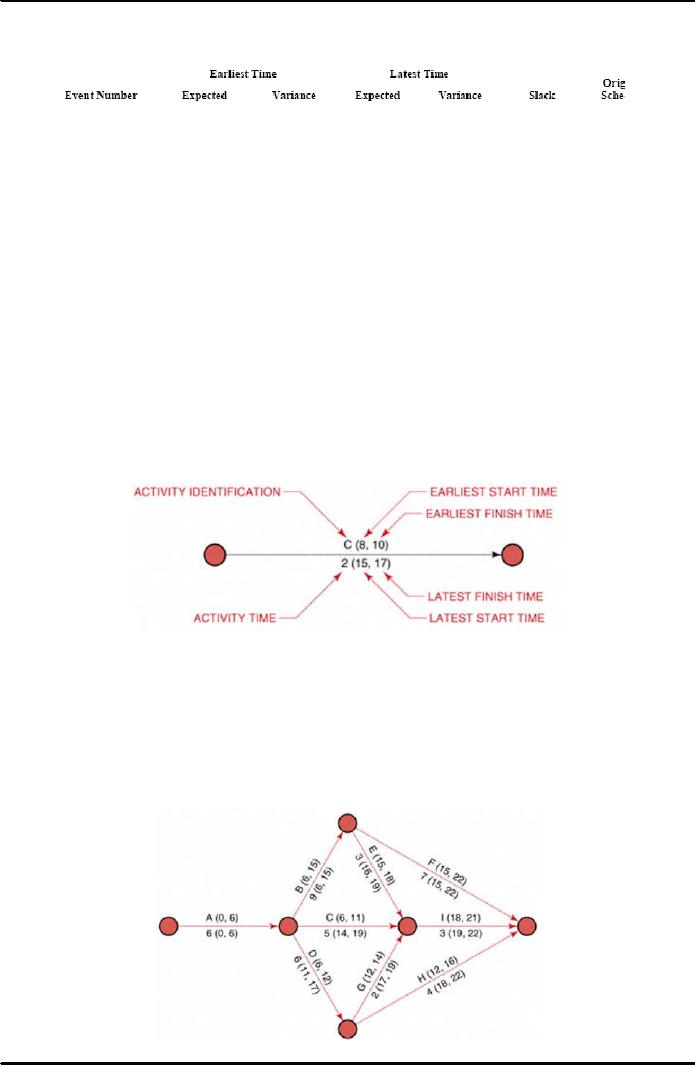
meeting the schedule. A sample of the
required information is shown in Table
29.1
below.
The earliest and latest times are considered as random
variables. The original
schedule
refers
to the schedule for event
occurrences that were established at the
beginning of the project.
206
Project
Management MGMT627
VU
The
last column in this table
gives the probability that the earliest
time will not be greater
than
the
original schedule time for
this event.
Table
29.1: PERT
Control Output
Information
In
the example shown in Figure 29.1, the
earliest and latest times were calculated for
each
event.
Some people prefer to calculate the
earliest and latest times for each
activity instead.
Also,
the earliest and latest times were identified
simply as the time or date
when an event can
be
expected to take place. To make full
use of the capabilities of PERT/CPM, we
could identify
the
following four
values:
�
The
earliest time when an activity
can start (ES)
�
The
earliest time when an activity
can finish (EF)
�
The
latest time when an activity
can start (LS)
�
The
latest time when an activity
can finish (LF)
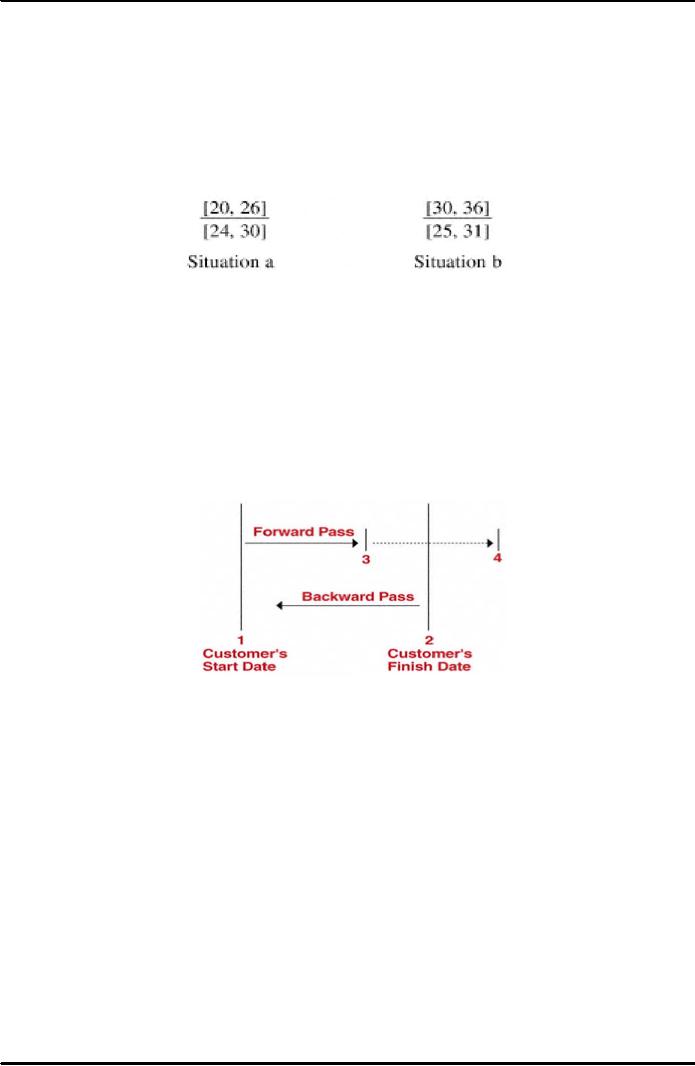
The
following Figure 29.3 below
shows the earliest and latest times identified on the
activity.
In
order to calculate the earliest starting times, we
must make a forward pass
through the
network
(that is, left to right).
The earliest starting time of a
successor activity is the latest of
the
earliest
finish dates of the predecessors.
The latest starting time is the
total of the earliest
starting
time and the activity
duration.
Figure
29.3: Slack
Identification
It
is important to note that to calculate
the finishing times we must make a
backward
pass
through
the network by calculating the latest
finish time. Since the activity
time is known, the
latest
starting time can be calculated by
subtracting the activity time
from the latest finishing
time.
The latest finishing time
for an activity entering a node is the
earliest finishing time of
the
activities
exiting the node.
Figure
29.4 below shows the earliest
and latest starting and
finishing times for a
typical
network.
Figure
29.4: A
Typical PERT Chart with
Slack Times
207
Project
Management MGMT627
VU
29.3
Slack
Identification:
Its
significance is that the identification
of slack time can function as an
early warning system
for
the project manager. As an example, if the
total slack time available begins to
decrease from
one
reporting period to the next,
that could indicate that
work is taking longer than
anticipated
or
that more highly skilled
labor is needed. A new
critical path could be
forming.
By
looking at the earliest and latest start
and finish times, we can
identify slack. As an example,
look
at the two situations
below:
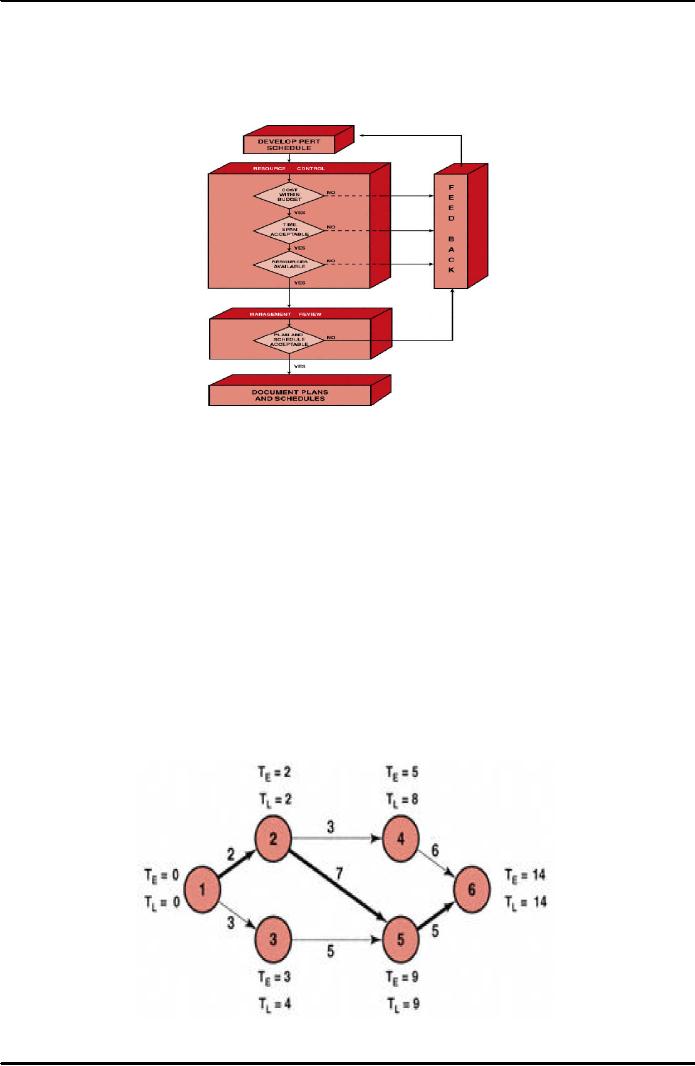
According
to these, in Situation
a,
the slack is easily identified as four
work units, where the
work
units can be expressed in hours,
days, weeks, or even months. In Situation
b,
the slack is
negative
five
units of work. This is
referred to as negative slack or negative
float.
Here
the question arises, what
can cause the slack to be negative?
Look at Figure 29.5
below.
When
performing a forward pass
through a network, we work
from left to right beginning
at the
customer's
starting milestone (position
1). The backward pass,
however, begins at the
customer's
end date milestone (position
2), not
(as
is often taught in the classroom) where
the
forward
pass ends. If the forward
pass ends at position 3,
which is before the customer's end
date,
it is possible to have slack on the critical
path.
Figure
29.5: Slack
Time
This
slack is often called reserve
time and
may be added to other
activities or filled
with
activities
such as report writing so
that the forward pass will
extend to the customer's
completion
date.
Note
that negative slack usually
occurs when the forward pass
extends beyond the
customer's
end
date, as shown by position 4 in the figure.
However, the backward pass is
still measured
from
the customer's completion date,
thus creating negative slack.
This is most likely to
result
when:
�
The
original plan was highly
optimistic, but
unrealistic
�
The
customer's end date was
unrealistic
�
One
or more activities slipped during
project execution
�
The
assigned resources did not
possess the correct skill
levels
�
The
required resources would not
be available until a later
date
In
any event, negative slack is an
early warning indicator that
corrective action is needed
to
maintain
the customer's end date.
208
Project
Management MGMT627
VU
29.4
Network
Re-planning:
We
know that once constructed, the
PERT/CPM charts provide the
framework from which
detailed
planning can be initiated and
costs can be controlled and
tracked. Much
iteration,
however,
are normally made during the
planning phase before the
PERT/CPM chart is finished.
Figure
29.6: Iteration
Process for PERT Schedule
Development
This
iteration process is shown in the Figure
29.6 above. The slack times form the
basis from
which
additional iterations, or network
replanning, can be performed.
Network replanning is
performed
either at the conception of the program
in order to reduce the length of the
critical
path,
or during the program, should the
unexpected occur. If all were to go
according to
schedule,
then the original PERT/CPM chart
would be unchanged for the duration of
the
project.
But, how many programs or
projects follow an exact schedule from
start to finish?
Let
us again consider Figure 29.1.
Suppose that activities
12 and 13 in it require
manpower
from
the same functional unit.
Upon inquiry by the project manager, the
functional manager
asserts
that he can reduce activity
12 by one week if he
shifts resources from
activity 13 to
activity
12. Should this happen,
however, activity 13
will increase in length by one
week.
Reconstructing
the PERT/CPM network as shown in Figure
29.7 below, the length of
the
critical
path is reduced by one week, and the
corresponding slack events are
likewise changed.
Figure
29.7: Network
Replanning of Figure
29.1
209

Project
Management MGMT627
VU
29.4.1
Network Replanning Techniques:
There
are two network replanning
techniques based almost entirely upon
resources:
resource
leveling and resource
allocation.
�
Resource
leveling is an attempt to eliminate the manpower
peaks and valleys by
smoothing
out the period-to-period resource
requirements. The ideal situation is
to
do
this without changing the end date.
However, in reality, the end date
moves out
and
additional costs are
incurred.
�
Resource
allocation is an attempt to find the
shortest possible critical path
based
upon
the available or fixed resources.
The problem with this
approach is that the
employees
may not be qualified
technically to perform on more than
one activity in
a
network.
Not
all PERT/CPM networks permit
such easy rescheduling of
resources. Project
managers
should make every attempt to reallocate
resources so as to reduce the
critical
path,
provided that the slack was
not intentionally planned as a safety
valve.
It
is important to note here
that transferring resources
from slack paths to more
critical
paths
is only one method for reducing expected
project time. Several other
methods are
available.
These are as follows:
�
Elimination
of some parts of the
project
�
Addition
of more resources
�
Substitution
of less time-consuming components or
activities
�
Parallelization
of activities
�
Shortening
critical path
activities
�
Shortening
early activities
�
Shortening
longest activities
�
Shortening
easiest activities
�
Shortening
activities that are least
costly to speed up
�
Shortening
activities for which you
have more resources
�
Increasing
the number of work hours per day
In
this regard, under the ideal
situation, the project start and end
dates are fixed, and
performance
within this time scale
must be completed within the
guidelines described
by
the statement of work. Should the
scope of effort have to be reduced in
order to meet
other
requirements, the contractor incurs a serious
risk in that the project may
be
canceled,
or performance expectations may no longer be
possible.
However,
adding resources is not
always possible. If the activities
requiring these added
resources
also call for certain
expertise, then the contractor may
not have qualified or
experienced
employees, and may avoid the risk.
The contractor might still
reject this
idea,
even if time and money were
available for training new
employees, because on
project
termination he might not have
any other projects to which to
assign these
additional
people. However, if the project is the
construction of a new facility,
then the
labor-union
pool may be large enough
that additional experienced manpower can
be
hired.
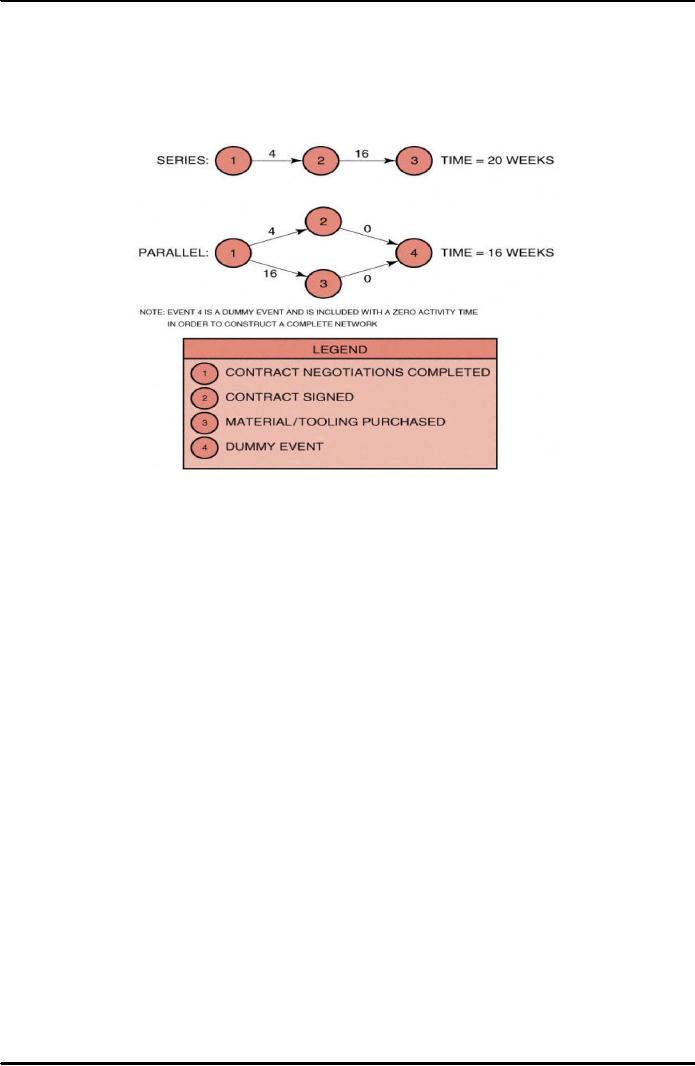
Another
aspect is parallelization of activities.
It can be regarded as accepting a risk
by
assuming
that a certain event can
begin in parallel with a
second event that
would
normally
be in sequence with it. This
is shown in Figure 29.8 below.
One of the biggest
headaches
at the beginning of any project is the
purchasing of tooling and
raw
materials.
As shown in Figure below, four
weeks can be saved by sending
out purchase
210
Project
Management MGMT627
VU
orders
after contract negotiations are
completed, but before the one-month
waiting
period
necessary to sign the contract. Here the
contractor incurs a risk. Should the
effort
be
canceled or the statement of work
change prior to the signing of the
contract, the
customer
incurs the cost of the termination
liability expenses from the vendors.
This
risk
is normally overcome by the issuance of a
long-lead procurement letter
immediately
following contract negotiations.
Figure
29.8: Parallelization
of PERT Activities
In
addition to this, there are
two other types of risk that
are common. In the first
situation,
engineering has not yet
finished the prototype, and manufacturing
must order
the
tooling in order to keep the end date
fixed. In this case,
engineering may
finally
design
the prototype to fit the
tooling.
In
the second situation, the subcontractor
finds it difficult to perform
according to the
original
blueprints. In order to save
time, the customer may allow
the contractor to work
without
blueprints, and the blueprints are
then changed to represent the
as-built end-
item.
As
a result of the complexities of large
programs, network re-planning becomes
an
almost
impossible task when
analyzed on total program
activities. It is often better
to
have
each department or division that develops
its own PERT/CPM networks,
on
approval
by the project office, and based on the
work breakdown structure.
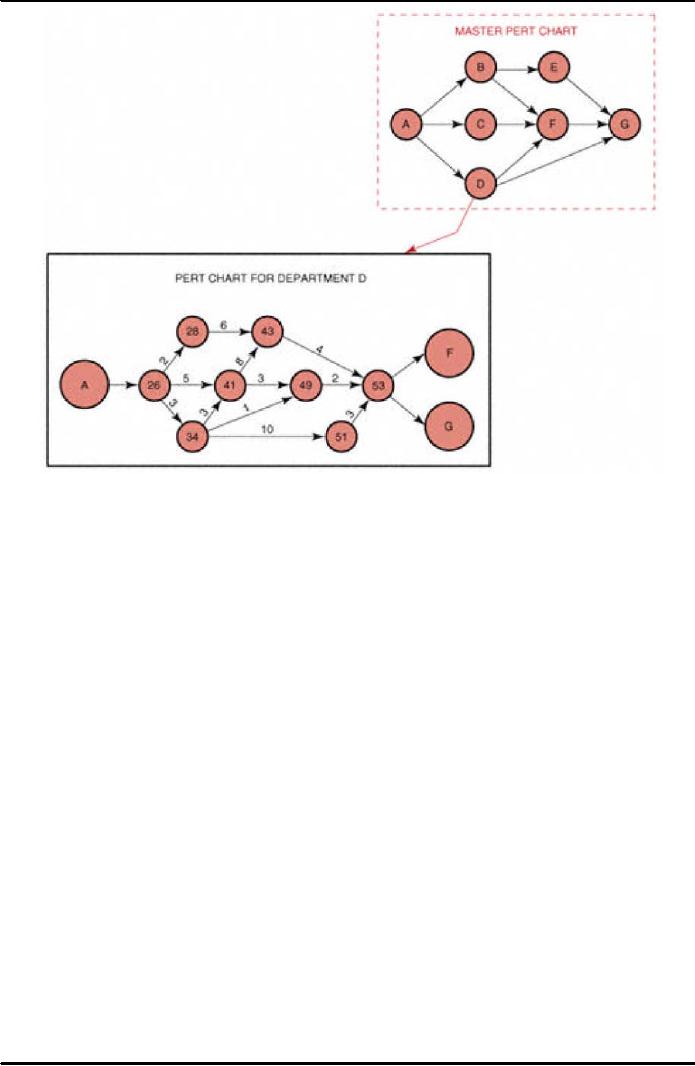
The
individual
PERT charts are then
integrated into one master chart to
identify total
program
critical paths, as shown in Figure
29.9 below. It should not be
inferred from
this
figure that department D does
not interact with other
departments or that
department
D is the only participant for
this element of the project.
In
addition, segmented PERT
charts can also be used
when a number of contractors
work
on the same program.
Each
contractor (or subcontractor) develops his
own PERT chart. It then
becomes the
responsibility
of the prime contractor to integrate
all of the subcontractors' PERT
charts
to
ensure that total program
requirements can be met.
211
Project
Management MGMT627
VU
Figure
29.9: Master
PERT chart breakdown by department
212
Table of Contents:
- INTRODUCTION TO PROJECT MANAGEMENT:Broad Contents, Functions of Management
- CONCEPTS, DEFINITIONS AND NATURE OF PROJECTS:Why Projects are initiated?, Project Participants
- CONCEPTS OF PROJECT MANAGEMENT:THE PROJECT MANAGEMENT SYSTEM, Managerial Skills
- PROJECT MANAGEMENT METHODOLOGIES AND ORGANIZATIONAL STRUCTURES:Systems, Programs, and Projects
- PROJECT LIFE CYCLES:Conceptual Phase, Implementation Phase, Engineering Project
- THE PROJECT MANAGER:Team Building Skills, Conflict Resolution Skills, Organizing
- THE PROJECT MANAGER (CONTD.):Project Champions, Project Authority Breakdown
- PROJECT CONCEPTION AND PROJECT FEASIBILITY:Feasibility Analysis
- PROJECT FEASIBILITY (CONTD.):Scope of Feasibility Analysis, Project Impacts
- PROJECT FEASIBILITY (CONTD.):Operations and Production, Sales and Marketing
- PROJECT SELECTION:Modeling, The Operating Necessity, The Competitive Necessity
- PROJECT SELECTION (CONTD.):Payback Period, Internal Rate of Return (IRR)
- PROJECT PROPOSAL:Preparation for Future Proposal, Proposal Effort
- PROJECT PROPOSAL (CONTD.):Background on the Opportunity, Costs, Resources Required
- PROJECT PLANNING:Planning of Execution, Operations, Installation and Use
- PROJECT PLANNING (CONTD.):Outside Clients, Quality Control Planning
- PROJECT PLANNING (CONTD.):Elements of a Project Plan, Potential Problems
- PROJECT PLANNING (CONTD.):Sorting Out Project, Project Mission, Categories of Planning
- PROJECT PLANNING (CONTD.):Identifying Strategic Project Variables, Competitive Resources
- PROJECT PLANNING (CONTD.):Responsibilities of Key Players, Line manager will define
- PROJECT PLANNING (CONTD.):The Statement of Work (Sow)
- WORK BREAKDOWN STRUCTURE:Characteristics of Work Package
- WORK BREAKDOWN STRUCTURE:Why Do Plans Fail?
- SCHEDULES AND CHARTS:Master Production Scheduling, Program Plan
- TOTAL PROJECT PLANNING:Management Control, Project Fast-Tracking
- PROJECT SCOPE MANAGEMENT:Why is Scope Important?, Scope Management Plan
- PROJECT SCOPE MANAGEMENT:Project Scope Definition, Scope Change Control
- NETWORK SCHEDULING TECHNIQUES:Historical Evolution of Networks, Dummy Activities
- NETWORK SCHEDULING TECHNIQUES:Slack Time Calculation, Network Re-planning
- NETWORK SCHEDULING TECHNIQUES:Total PERT/CPM Planning, PERT/CPM Problem Areas
- PRICING AND ESTIMATION:GLOBAL PRICING STRATEGIES, TYPES OF ESTIMATES
- PRICING AND ESTIMATION (CONTD.):LABOR DISTRIBUTIONS, OVERHEAD RATES
- PRICING AND ESTIMATION (CONTD.):MATERIALS/SUPPORT COSTS, PRICING OUT THE WORK
- QUALITY IN PROJECT MANAGEMENT:Value-Based Perspective, Customer-Driven Quality
- QUALITY IN PROJECT MANAGEMENT (CONTD.):Total Quality Management
- PRINCIPLES OF TOTAL QUALITY:EMPOWERMENT, COST OF QUALITY
- CUSTOMER FOCUSED PROJECT MANAGEMENT:Threshold Attributes
- QUALITY IMPROVEMENT TOOLS:Data Tables, Identify the problem, Random method
- PROJECT EFFECTIVENESS THROUGH ENHANCED PRODUCTIVITY:Messages of Productivity, Productivity Improvement
- COST MANAGEMENT AND CONTROL IN PROJECTS:Project benefits, Understanding Control
- COST MANAGEMENT AND CONTROL IN PROJECTS:Variance, Depreciation
- PROJECT MANAGEMENT THROUGH LEADERSHIP:The Tasks of Leadership, The Job of a Leader
- COMMUNICATION IN THE PROJECT MANAGEMENT:Cost of Correspondence, CHANNEL
- PROJECT RISK MANAGEMENT:Components of Risk, Categories of Risk, Risk Planning
- PROJECT PROCUREMENT, CONTRACT MANAGEMENT, AND ETHICS IN PROJECT MANAGEMENT:Procurement Cycles