 |

Production
and Operations Management
MGT613
VU
Lesson
09
Time
Series Forecasts
�Trend
-
long-term upward or downward
movement in data often relates to
population shifts,
changing
incomes, and cultural changes.
�Seasonality
-
short-term fairly regular
variations in data related to
factors like weather,
festive
holidays
and vacations. Mostly experienced by
supermarkets, restaurants, theatres,
theme
parks.
�Cycle
wavelike variations of more
than one year's duration
these occurs because of
political,
economic
and even agricultural
conditions
�Irregular
variations -
caused by unusual circumstances
such as severe weathers,
earthquakes,
worker
strikes, or major change in product or
service. They do not capture
or reflect the true
behavior
of a variable and can distort the
overall picture. These should be
identified and
removed
from the data.
�Random
variations -
caused by chance and are in reality
are the residual variations
that remain
after
the other behaviors have
been identified and accounted
for.
Forecast
Variations
Techniques
for Averaging
�Moving
average
�Weighted
moving average
�Exponential
smoothing
�Moving
average A
technique that averages a
number of recent actual
values, updated as new
values
become available.
�Weighted
moving average
More recent values in a
series are given more
weight in
computing
the forecast.
Simple
Moving Average Formula
�The
simple moving average model
assumes an average is a good estimator of
future behavior
�The
formula for the simple
moving average is:
A
t-1 + A t-2
+ A t-3 +
... + A t-n
Ft =
n
Ft =
Forecast for the coming
period
N
= Number of periods to be
averaged
At-1 =
Actual occurrence in the past
period for up to "n"
periods
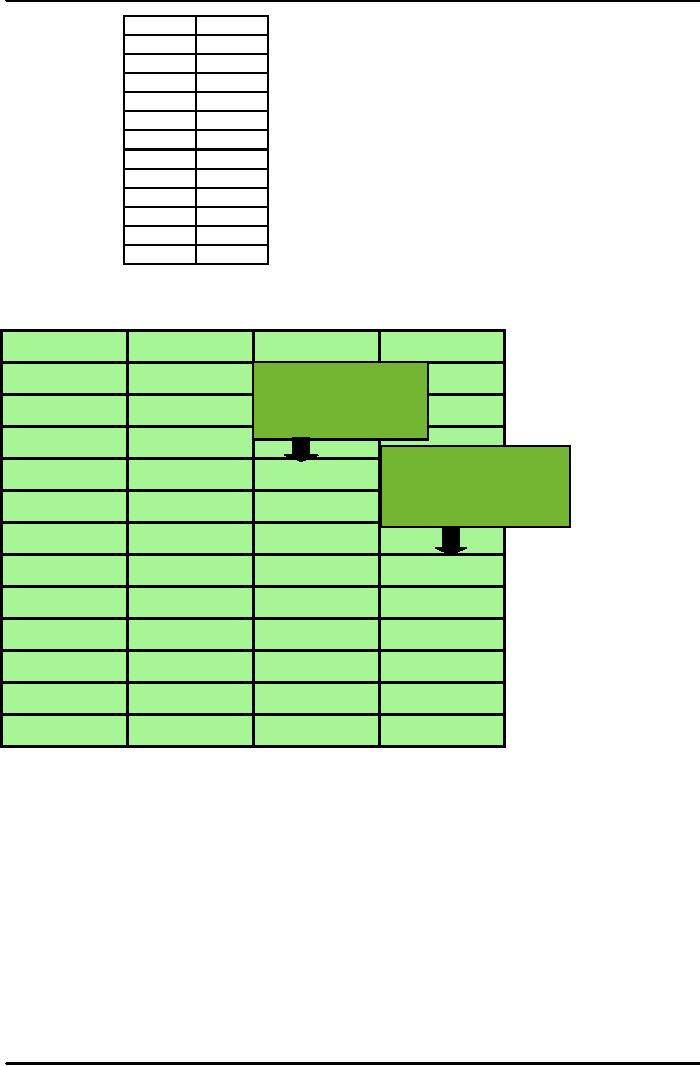
Simple
Moving Average Problem
(1)
Question:
What are the 3-week and
6-week moving average forecasts for
demand?
Assume
you only have 3 weeks and 6 weeks of
actual demand data for the
respective forecasts.
37
Production
and Operations Management
MGT613
VU
Week
Demand
1
650
2
678
3
720
4
785
5
859
6
920
7
850
8
758
9
892
10
920
11
789
12
844
Simple
Moving Average Solution
(1)
W
eek
Demand
3-W eek
6-W
eek
1
650
F4=(650+678+720)/
678
3
=682.67
2
3
720
F
=(650+678+720
4
785
682.67
7
+785+859+920)/6
5
859
727.67
=768.67
6
920
788.00
7
850
854.67
768.67
8
758
876.33
802.00
9
892
842.67
815.33
10
920
833.33
844.00
11
789
856.67
866.50
12
844
867.00
854.83
38
Production
and Operations Management
MGT613
VU
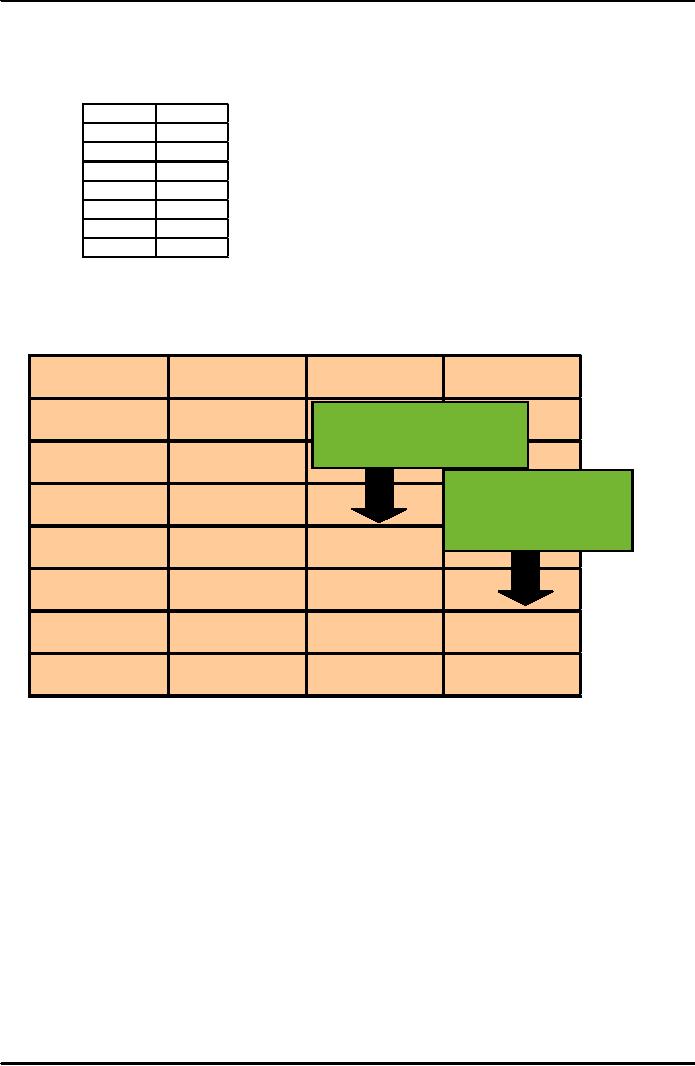
Simple
Moving Average Problem (2)
Data
Question:
What is the 3 week moving
average forecast for this
data?
Assume
you only have 3 weeks and 5 weeks of
actual demand data for the
respective forecasts.
Week
Demand
1
820
2
775
3
680
4
655
5
620
6
600
7
575
Simple
Moving Average Problem (2)
Solution
W
eek
Demand
3-W
eek
5-W
eek
1
820
F4=(820+775+680)/3
=758.33
2
775
F6=(820+775+680
3
680
+655+620)/5
=710.00
4
655
758.33
5
620
703.33
6
600
651.67
710.00
7
575
625.00
666.00
39
Table of Contents:
- INTRODUCTION TO PRODUCTION AND OPERATIONS MANAGEMENT
- INTRODUCTION TO PRODUCTION AND OPERATIONS MANAGEMENT:Decision Making
- INTRODUCTION TO PRODUCTION AND OPERATIONS MANAGEMENT:Strategy
- INTRODUCTION TO PRODUCTION AND OPERATIONS MANAGEMENT:Service Delivery System
- INTRODUCTION TO PRODUCTION AND OPERATIONS MANAGEMENT:Productivity
- INTRODUCTION TO PRODUCTION AND OPERATIONS MANAGEMENT:The Decision Process
- INTRODUCTION TO PRODUCTION AND OPERATIONS MANAGEMENT:Demand Management
- Roadmap to the Lecture:Fundamental Types of Forecasts, Finer Classification of Forecasts
- Time Series Forecasts:Techniques for Averaging, Simple Moving Average Solution
- The formula for the moving average is:Exponential Smoothing Model, Common Nonlinear Trends
- The formula for the moving average is:Major factors in design strategy
- The formula for the moving average is:Standardization, Mass Customization
- The formula for the moving average is:DESIGN STRATEGIES
- The formula for the moving average is:Measuring Reliability, AVAILABILITY
- The formula for the moving average is:Learning Objectives, Capacity Planning
- The formula for the moving average is:Efficiency and Utilization, Evaluating Alternatives
- The formula for the moving average is:Evaluating Alternatives, Financial Analysis
- PROCESS SELECTION:Types of Operation, Intermittent Processing
- PROCESS SELECTION:Basic Layout Types, Advantages of Product Layout
- PROCESS SELECTION:Cellular Layouts, Facilities Layouts, Importance of Layout Decisions
- DESIGN OF WORK SYSTEMS:Job Design, Specialization, Methods Analysis
- LOCATION PLANNING AND ANALYSIS:MANAGING GLOBAL OPERATIONS, Regional Factors
- MANAGEMENT OF QUALITY:Dimensions of Quality, Examples of Service Quality
- SERVICE QUALITY:Moments of Truth, Perceived Service Quality, Service Gap Analysis
- TOTAL QUALITY MANAGEMENT:Determinants of Quality, Responsibility for Quality
- TQM QUALITY:Six Sigma Team, PROCESS IMPROVEMENT
- QUALITY CONTROL & QUALITY ASSURANCE:INSPECTION, Control Chart
- ACCEPTANCE SAMPLING:CHOOSING A PLAN, CONSUMER’S AND PRODUCER’S RISK
- AGGREGATE PLANNING:Demand and Capacity Options
- AGGREGATE PLANNING:Aggregate Planning Relationships, Master Scheduling
- INVENTORY MANAGEMENT:Objective of Inventory Control, Inventory Counting Systems
- INVENTORY MANAGEMENT:ABC Classification System, Cycle Counting
- INVENTORY MANAGEMENT:Economic Production Quantity Assumptions
- INVENTORY MANAGEMENT:Independent and Dependent Demand
- INVENTORY MANAGEMENT:Capacity Planning, Manufacturing Resource Planning
- JUST IN TIME PRODUCTION SYSTEMS:Organizational and Operational Strategies
- JUST IN TIME PRODUCTION SYSTEMS:Operational Benefits, Kanban Formula
- JUST IN TIME PRODUCTION SYSTEMS:Secondary Goals, Tiered Supplier Network
- SUPPLY CHAIN MANAGEMENT:Logistics, Distribution Requirements Planning
- SUPPLY CHAIN MANAGEMENT:Supply Chain Benefits and Drawbacks
- SCHEDULING:High-Volume Systems, Load Chart, Hungarian Method
- SEQUENCING:Assumptions to Priority Rules, Scheduling Service Operations
- PROJECT MANAGEMENT:Project Life Cycle, Work Breakdown Structure
- PROJECT MANAGEMENT:Computing Algorithm, Project Crashing, Risk Management
- Waiting Lines:Queuing Analysis, System Characteristics, Priority Model