 |
Production
and Operations Management
MGT613
VU
Lesson
44
PROJECT
MANAGEMENT
Learning
Objectives
After
learning about the network diagrams, the
project life cycle and the
responsibilities of project
manager.
We will now learn the
important concept of time
estimates (which is based on
computing
algorithms
of Early Start, Early Finish,
Late Start and Late Finish)
and variances which are used
to
control
the project activities. We will consider
important aspects like the
forward and backward
path
time estimates, Project Crashing,
Time Cost Trade Offs,
Project Management Software,
Risk
Management
and develop a project management
based Operations Strategy.
Time
Estimates
There
are two common types of time
estimates namely
1.
Deterministic: Time estimates
that are fairly
certain
2.
Probabilistic: Estimates of times that
allow for variation
Example:
Hospital
We
take the same hospital
example and now place the time
dimension to it .
6
weeks
4
Order
Machine
Machines
Setup
3 weeks
2
8
weeks
Locate
Remodel
facilities
Operational
11
weeks
1
5
6
1
week
Interview
Hire
and train
4
weeks
Medical
Staff
9
weeks
3
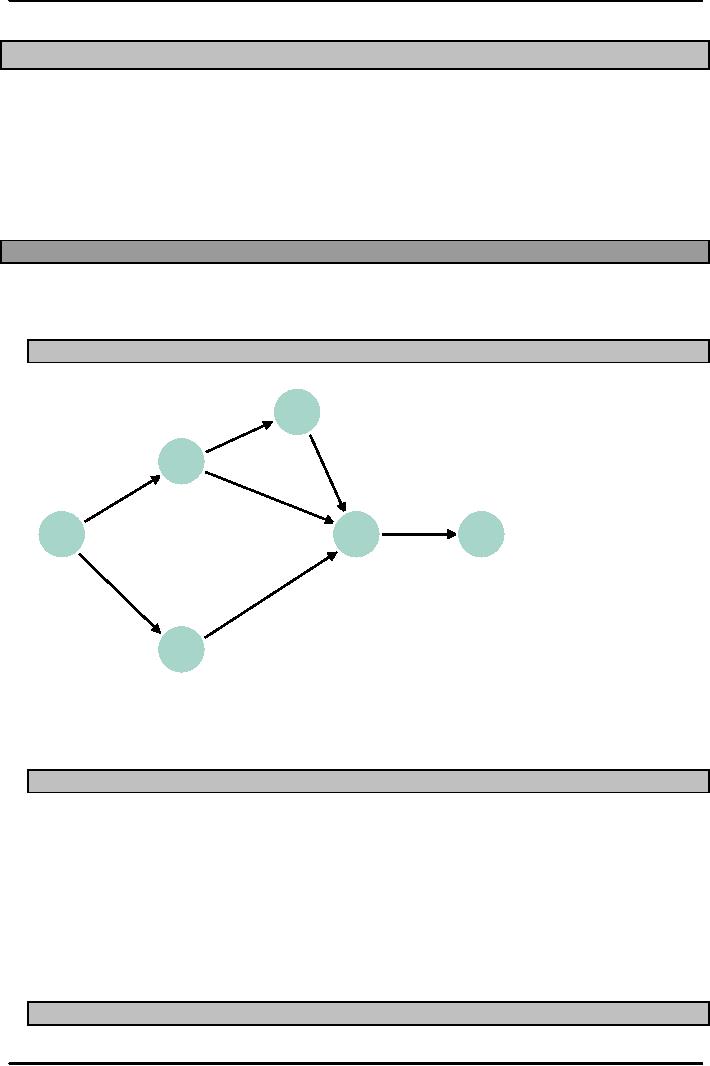
The
activities from locating the
facility to making the hospital
fully are represented in the
form of a
network
diagram. The student should
try to write down the
activities along with the
activity
description
then try to draw the network
diagram using both the
activity on node and activity
on
arrow
as practice.
Computing
Algorithm
Network
activities
1.
ES: early start
2.
EF: early finish
3.
LS: late start
4.
LF: late finish
Used
to determine
1.
Expected project duration
2.
Slack time
3.
Critical path
Probabilistic
Time Estimates
202
Production
and Operations Management
MGT613
VU
1.
Optimistic time : Time
required under optimal
conditions
2.
Pessimistic time: Time
required under worst
conditions
3.
Most likely time: Most
probable length of time that
will be required
Probabilistic
Estimates require two
important parameters like Expected
Time and
Variance
represented by te and
σ
respectively.
t
t
t
to
Activity
Optimistic
Most
Likely
Pessimistic
Time
Start
Time
Time
to +
4tm +tp
te
=
6
where
te =
expected time
to =
optimistic time
tm =
most likely time
tp =
pessimistic time
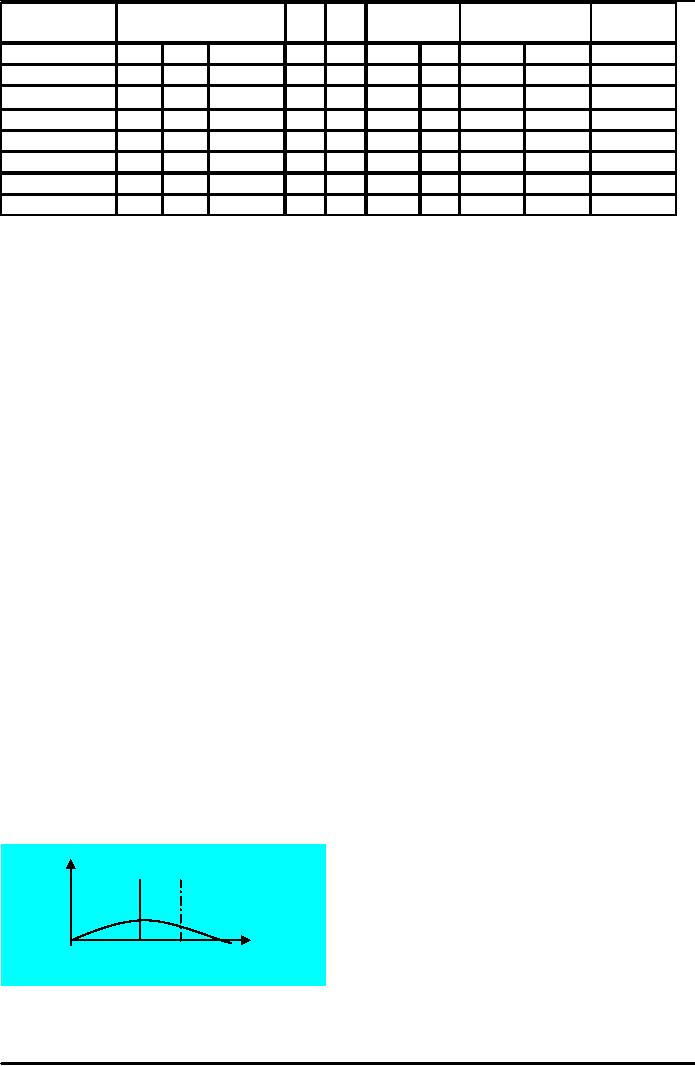
Variance
The
word variance reflects the square of
standard deviation of activities on a
path and represented
by
σ2. The size of
variance reflects the degree of
uncertainty associated with
activity's time, the
larger
the variance the larger the
uncertainty.
(tp
to)2
2
σ
=
36
σ2 =
variance
to =
optimistic time
tp =
pessimistic
time
203
Production
and Operations Management
MGT613
VU
Example
Optimistic
Most
likely
Pessimistic
Time
Time
Time
2-4-6
b
2-3-5
1-3-4
c
a
3-4-5
3-5-7
5-7-9
d
e
f
2-3-6
3-4-6
g
i
4-6-8
h
Path
Probabilities
Specified
time Path
Z
mean
Z
indicates how many standard
deviations of the path distribution the
specified tine
is
beyond the expected path duration. If the
value of "z" is +2.50 or more, treat the
probability of
path
completion by the specified time as
100 percent.
Time-cost
Trade-offs: Crashing
Crash
is the shortening activity
duration
Procedure
for crashing
Crash
the project one period at a
time
Only
an activity on the critical
path
Crash
the least expensive
activity
Multiple
critical paths: find the sum
of crashing the least expensive activity
on each critical path
Project
Crashing
Crashing
a project involves paying more
money to complete a project more
quickly.
Since
the critical path determines the length
of a project, it makes sense to
reduce the length of
activities
on the critical path.
Critical
Path activities should be
reduced until the project is
reduced to the desired length or you
are
paying
more per day than you
save.
If
you have multiple Critical
Paths, they should be
shortened simultaneously.
Time-Cost
Trade-Offs: Crashing
Time-Cost
Trade-Offs: Crashing
204
Production
and Operations Management
MGT613
VU
Total
Cost
Expected
Indirect
Shorte
CRAS
Cumulative
Cost
of
Crashing
Shorte
Optimum
Example
The
manager of a PHA is about to
undertake a reforestation project
throughout Pakistan. He is first
asked
to carryout a pilot project.
The project will involve the
following six
activities:
SR.
ACTIVITY
PRECEEDS
TIME
ESITIMATES ( DAYS)
#
OPTIMISTIC
MOST LIKELY" PESSIMISTIC
"
a"
m"
"
b"
START
U,V
U
W
35
50
65
V
W,X
28
40
52
W
Z
26
35
44
X
Y
28
40
52
Y
Z
26
29
38
Z
END
36
60
84
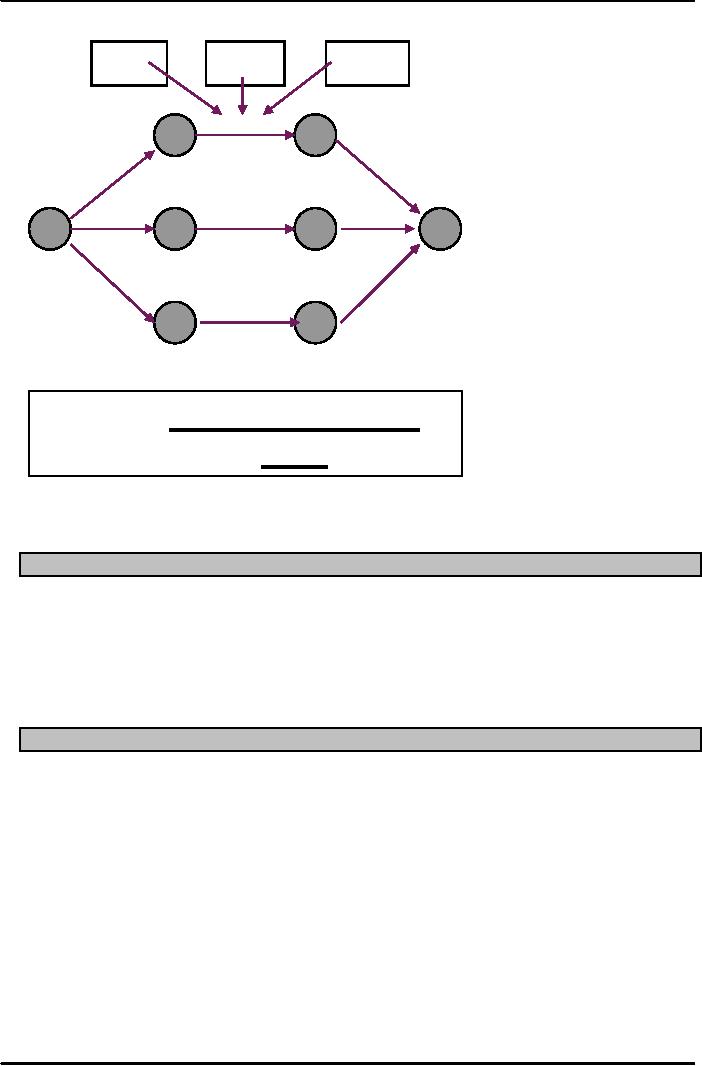
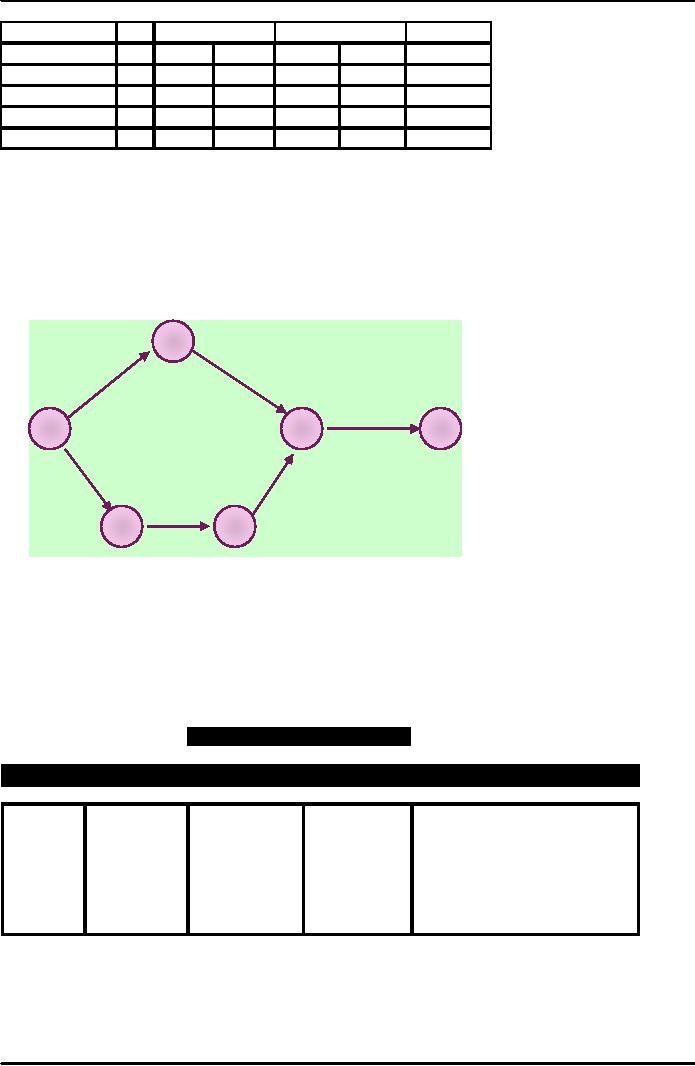
Solution:
First of all, we construct network
diagram based on Activity on
Node followed by
calculating
the probabilistic time "t" and standard
deviation "σ"
using the formulas given
below and
then
the ES,EF and LS, LF using the
forward pass (progression) and backward
pass (progression)
respectively.
t
= (a+4m+b)/6
and
σ
=
(b-a)/6
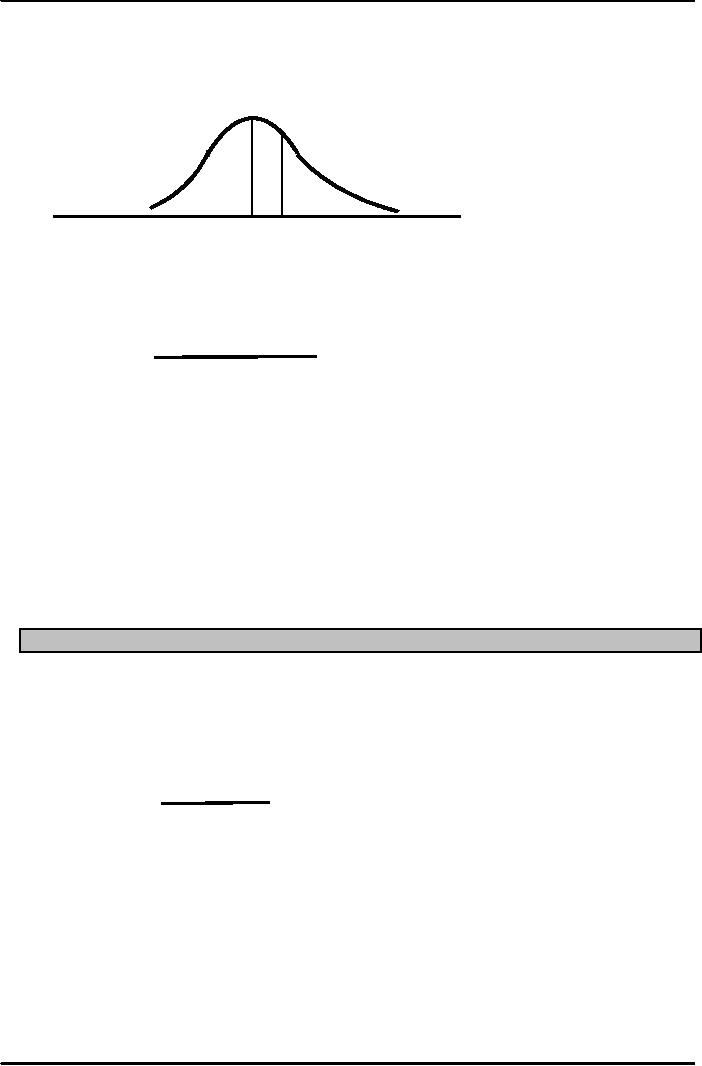
The
denominator of "6" reflects the concept of
area under the curve that
the range of data lies to + 3
Standard
Deviations from mean also it
shows the weighted average.
End
35
50
Start
U
W
Z
40
40
Y
40
X
V
205
Production
and Operations Management
MGT613
VU
ACTIVITY
TIME ESITIMATES
FORWARD
BACKWARD
SLACK
(
DAYS)
"
a" " m"
"
b"
t
σ
ES
EF
LS
LF
n
START
U
35
50
65
50
5
0
50
25
75
25
V
28
40
52
40
4
0
40
0
40
0
W
26
35
44
35
3
50
85
75
110
25
X
28
40
52
40
4
40
80
40
80
0
Y
26
29
38
30
2
80
110
80
110
0
Z
36
60
84
60
8
110
170
110
170
0
I.
Time
"t" = (a+4m+b)/6
Activity
U =
(35+4(50)
+65)/6= (100+200)/6= 300/6= 50
days
Activity
V =
(28+4(40)
+52)/6= (80+160)/6= 240/6= 40
days
Activity
W =
(26+4(35)
+44)/6= (70+140)/6= 210/6= 35
days
Activity
X =
(28+4(40)
+52)/6= (80+160)/6= 240/6= 40
days
Activity
Y =
(26+4(29)
+38)/6= (64+116)/6= 180/6= 30
days
Activity
Z =
(36+4(60)
+84)/6= (120+240)/6= 360/6= 60
days
Standard
Deviation "σ" =
(b-a)/6
Activity
U
=
(65-35)/6=
(30)/6= 5 days
Activity
V
=
(52-28)/6=
(24)/6= 4 days
Activity
W
=
(44-26)/6=
(18)/6= 3 days
Activity
X
=
(52-28)/6=
(24)/6= 4 days
Activity
Y
=
(38-26)/6=
(12)/6= 2 days
Activity
Z
=
(84-36)/6=
(48)/6= 8 days
Critical
Path
The
critical path is the longest
path taken for the project
to complete.
From
Start to End there are three possible
paths as from the Network
Diagram
Start
U-W-Z-End = 50 + 35+60
=
145 days (logically
incorrect)
Start-V-X-Y-Z-End=
40+40+30+60 = 170
days
Start-V-W-Z-End=
40+35+60
=
135 days (logically
incorrect)
For
the Critical Path, we also calculate
the standard deviation of
Project portfolio
Start-V-X-Y-Z-End=σ2=
[(4)2+(4)2+(2)2+(8)2]= (16+16+4+64)= (100
)
Then
σ
=
Square Root ( 100) = 10
days
Also
individual sum of standard
deviations = 4+4+2+8 = 18
days
Since
portfolio project σ
= 10
days is less than individual
sum of 18 days, it shows our
value of
portfolio
σ
is
correct
Normal
Distribution
"z"
= (X-μ)/σ , now
since X= 200 days μ
=
170 days,
σ= 10
days
μ
=
170 days,
σ= 10
days
X=
200 days
Also
Using the Normal Probability
Curve
Z=
(X μ)/σ
=
(200-170)/10= 30/10=
3.0
According
to the standard normal table, the
area at z = 3 is 0.4987. Adding
0.5 for left hand side
of
the
standard normal curve, we get
0.9987.
206
Production
and Operations Management
MGT613
VU
Q.3:
What is the estimated expected (mean) time
for Project
Completion?
135
days
145
days
170
days
180
days
255
days
The
answer is 170 Days (Choice
C)
Q.4:
What is the estimated slack time for
activity W?
0
days
25
days
35
days
45
days
85
days
The
answer is 25 Days (Choice
B)
Q.5:
What is the probability that the
critical path for this
project will be completed with in
200
days?
0.8413
0.9544
0.9772
0.9974
0.9987
Based
on the calculations of critical path
"σ"
above, the answer comes out
to be 0.9987 (Choice
E).
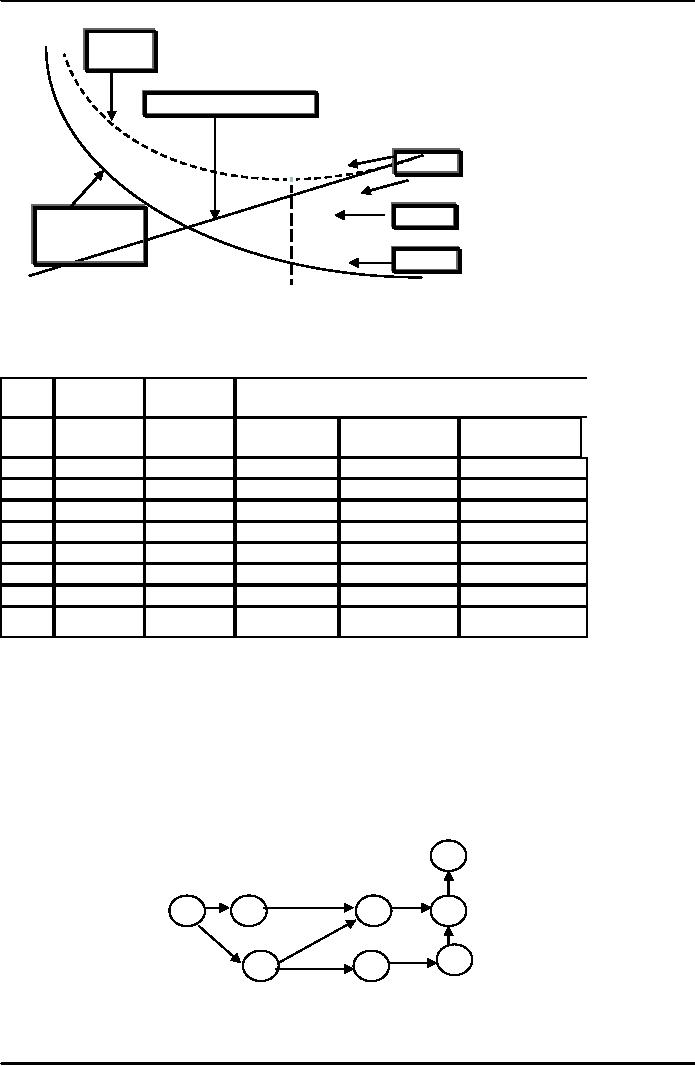
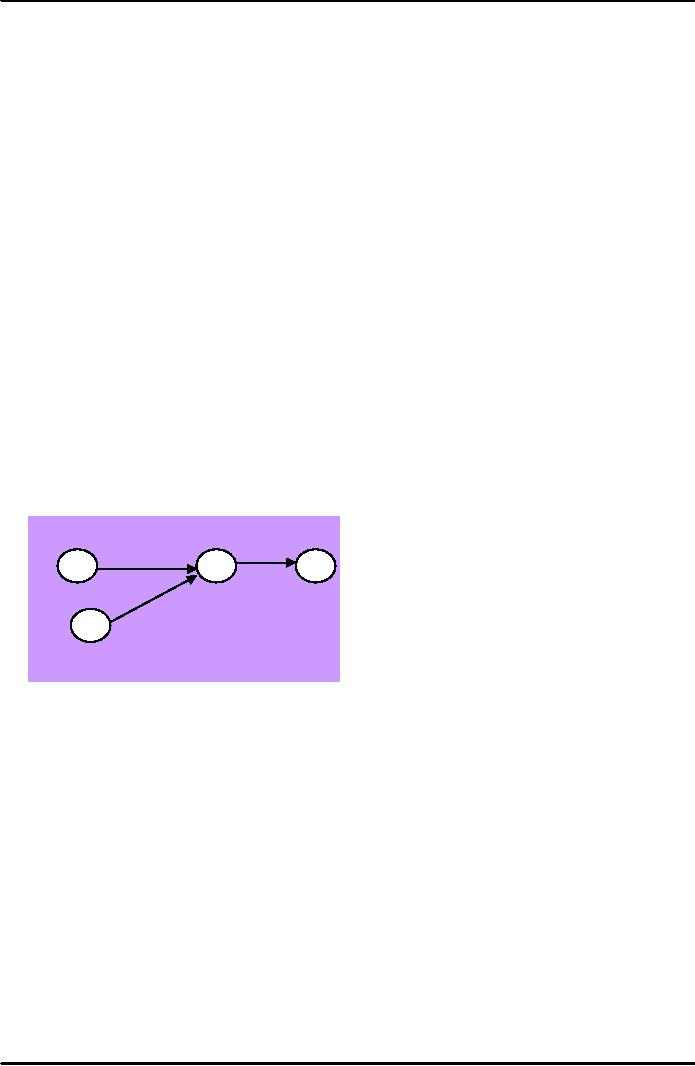
4
7
8
10
11
2
9
Given
the portion of the network shown above,
what is the earliest finish time
for activity 10-11,
if
the
earliest start time of 8-10 is
"12" and the earliest start time of
9-10 is "13"?
22
23
24
25
26
Q.1:
What is the estimated expected (mean) time
for activity Y?
30
days
29
days
38
days
26
days
35
days
The
answer is 30 Days (Choice
A)
207
Production
and Operations Management
MGT613
VU
ACTIVITY
FORWARD
BACKWARD
SLACK
t
ES
EF
LS
LF
n
START
8
to 10
4
12
16
12
16
0
9
to 10
2
13
15
14
16
1
10
to 11
7
16
16
23
0
23
Q.2:
What is the estimated standard deviation
in the time for activity
Z?
3
days
2
days
4
days
8
days
5
days
The
answer is 8 Days (Choice
D)
10
6
b
a
2
f
5
9
4
d
SOLVED
EXAMPLES
You
have been hired as the Chief
Project Manager, by your
city's Kabbadi Association
for construction,
renovation
and repairs of the city Kabbadi
Stadium. The Kabbadi
Associations President had in the
past
hired
an Indian Consultant to help
him carry out the task of
expanding and improving the
hockey
stadium.
The Indian Consultant left
the work after collecting the
time (in days) associated
with the
activities
and developing the forward path
network diagrams.
TIME
ESTIMATES
ACTIVITY
OPTIMISTIC MOST LIKELY PESSIMISTIC
IMMEDIATE PREDECESSOR
A
1
4
7
-
B
2
6
7
-
C
3
3
6
B
D
6
13
14
A
E
3
6
12
A,C
F
6
8
16
B
G
1
5
6
E,F
208
Production
and Operations Management
MGT613
VU
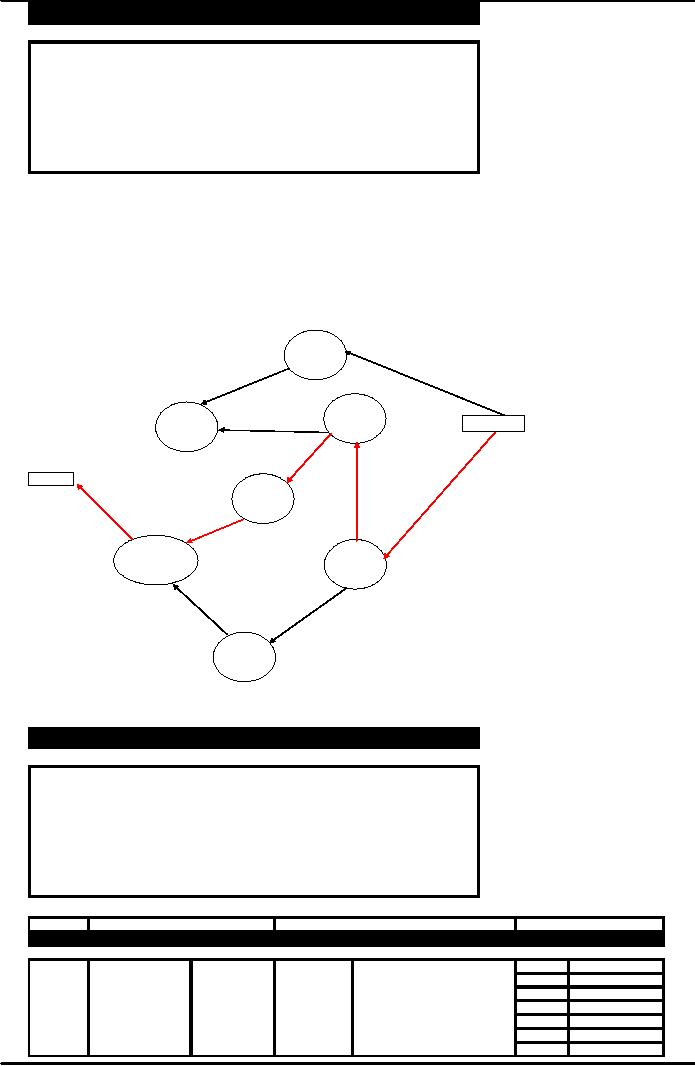
D
E
Finish
A
Start
C
B
G
F
The
Association President has asked
you to calculate the following:
a.
Calculate the expected time and
variance for each
activity.
b.
Calculate the activity slacks
and determine critical path
using expected activity
times?
c.
What is the probability of completing the
project with in 550
days?
Solution
We
first of all calculate the Expected times and
variances for each activity
using the formulae
respectively
te=
(a+4m+b)/6
σ2= ((b-a)/6)2
The
results are presented in the
form of the table
ACTIVITY
EXPECTED TIME
VARIANCE
4.00
1.00
A
5.50
0.69
B
3.50
0.25
C
12.00
1.78
D
6.50
2.25
E
9.00
2.78
F
4.50
0.69
G
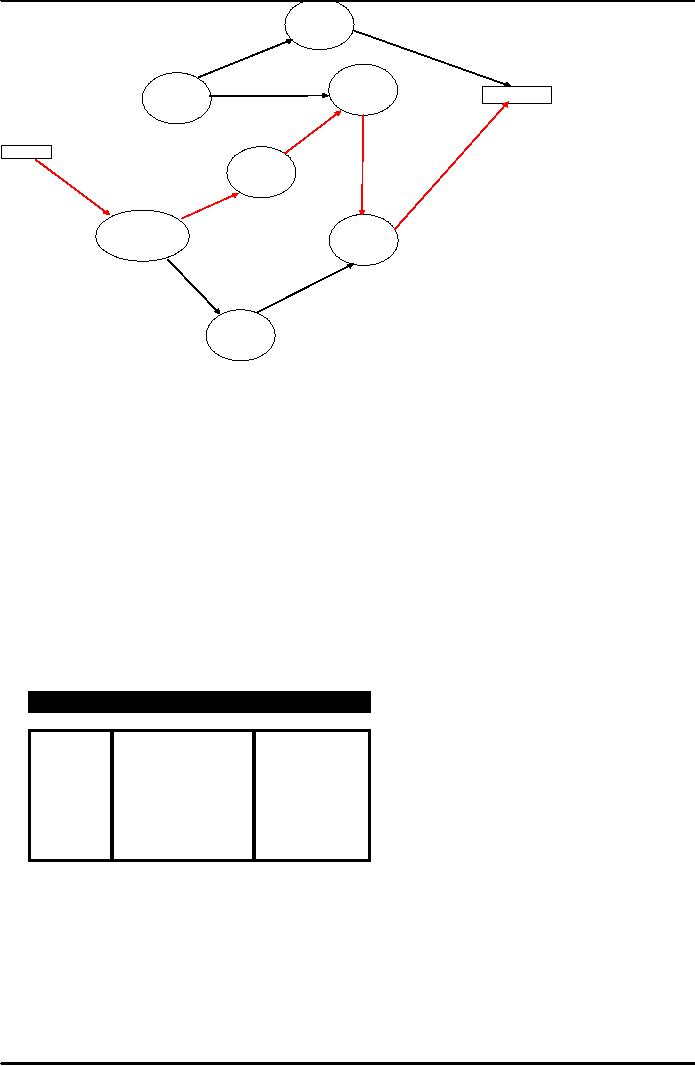
f.
We
need to calculate the Earliest Start, Latest Start,
Earliest Finish, Latest Finish
represented by
the
symbols ES, LS, EF and LF respectively.
We use the forward path
network diagram as
provided
by the hockey association's president.
209
Production
and Operations Management
MGT613
VU
ACTIVITY
ES
EF
t
0.00
4.00
4.00
A
0.00
5.50
5.50
B
5.50
9.00
3.50
C
4.00
16.00
12.00
D
9.00
15.50
6.50
E
5.50
14.50
9.00
F
15.50
20.00
4.50
G
As
we can see from the table
above the earliest time by which Activity
G would finish is 20 days
and
requires
4.5 days of time to complete. We
need to know calculate values of Latest Start and
Latest
Finish
using the backward path.
Please refer to the backward
path diagram below, the
direction of
arrows
have been reversed indicating
that we are actually back
tracing the activities with the
same times
as
calculated above using forward
path.
BACKWARD
PATH
D
E
Finish
A
Start
C
B
G
F
ACTIVITY
LS
LF
t
G
15.50
20.00
4.50
F
6.50
15.50
9.00
E
9.00
15.50
6.50
D
8.00
20.00
12.00
C
5.50
9.00
3.50
B
0.00
5.50
5.50
A
4.00
8.00
4.00
Start
Finish
ACTIVITY
ES
LS
EF
LF
SLACK
CRITICAL
PATH
0.00
4.00
4.00
8.00
4.00
NO
A
0.00
0.00
5.50
5.50
0.00
YES
B
5.50
5.50
9.00
9.00
0.00
YES
C
4.00
8.00
16.00
20.00
4.00
NO
D
9.00
9.00
15.50
15.50
0.00
YES
E
5.50
13.00
14.50
15.50
1.00
NO
F
15.50
15.50
20.00
20.00
0.00
YES
G
210

Production
and Operations Management
MGT613
VU
PATH
EXPECTED
TIME
VARIANCE
A-D
16.00
2.78
A-E-G
15.00
3.94
B-C-E-G
20.00
3.89
B-F-G
19.00
4.17
The
critical path is B-C-E-G
with total expected time of 20
days.
c.
We
first calculate the z value
(t-te)/√σ2
Z
=
=
(23-20)/√3.89
=
3/1.972
=
1.5210
Using
the Normal Distribution table, we
calculate the probability of completing the
project in 23 days to
be
0.9357.
Project
Management Software
Tools
1.
Computer aided design
(CAD)
2.
Groupware (Lotus
Notes)
3.
Project management
software
a.
CA Super Project
b.
Harvard Total Manager
c.
MS Project
d.
Sure Track Project
Manager
e.
Time Line
Advantages
of PM Software
1.
Imposes a methodology
2.
Provides logical planning
structure
3.
Enhances team
communication
4.
Flag constraint
violations
5.
Automatic report formats
6.
Multiple levels of reports
7.
Enables what-if
scenarios
8.
Generates various chart types
Project
Risk Management
Risk:
occurrence of events that have
undesirable consequences
1.
Delays
2.
Increased costs
3.
Inability to meet
specifications
4.
Project termination
Risk
Management
1.
Identify potential risks
2.
Analyze and assess
risks
3.
Work to minimize occurrence of
risk
4.
Establish contingency plans
211

Production
and Operations Management
MGT613
VU
Operations
Strategy
1.
Many Organizations have setup a
separate Project Management department or
cell to administer
unique
and non repetitive
activities.
2.
The scope of the project
decides whether to use a
project management software
tool or not.
3.
Project teams normally operate as a
matrix team with employees
from different
functional
departments
working with the project
team. In such situations the
organizations device a
strategy
that project manger should
lead the team as he or she is more
aware of the situation
being
faced by the whole organization as well
as the constituent functional
departments.
Summary
1.
Projects
are unique set of activities
established to given set of objectives in
a limited time span.
2.
PERT
and CPM two commonly used
techniques for developing and monitoring
projects.
3.
Two
slightly different conventions
can be used for constructing
a network diagram.
4.
The
task of developing and
updating project networks
quickly becomes projects of even
moderate
size or PC applications.
5.
A deterministic approach is useful for
estimating the duration of the project,
when activity times
can
be fairly well established.
6.
In some instances, it may be possible to
shorten or crash the length of a project
by shortening
one
or more of the project activities.
7.
Often Projects are shortened
to the point where the cost of additional
reduction would
exceed
the
benefit of additional reduction to a
specified time.
212
Table of Contents:
- INTRODUCTION TO PRODUCTION AND OPERATIONS MANAGEMENT
- INTRODUCTION TO PRODUCTION AND OPERATIONS MANAGEMENT:Decision Making
- INTRODUCTION TO PRODUCTION AND OPERATIONS MANAGEMENT:Strategy
- INTRODUCTION TO PRODUCTION AND OPERATIONS MANAGEMENT:Service Delivery System
- INTRODUCTION TO PRODUCTION AND OPERATIONS MANAGEMENT:Productivity
- INTRODUCTION TO PRODUCTION AND OPERATIONS MANAGEMENT:The Decision Process
- INTRODUCTION TO PRODUCTION AND OPERATIONS MANAGEMENT:Demand Management
- Roadmap to the Lecture:Fundamental Types of Forecasts, Finer Classification of Forecasts
- Time Series Forecasts:Techniques for Averaging, Simple Moving Average Solution
- The formula for the moving average is:Exponential Smoothing Model, Common Nonlinear Trends
- The formula for the moving average is:Major factors in design strategy
- The formula for the moving average is:Standardization, Mass Customization
- The formula for the moving average is:DESIGN STRATEGIES
- The formula for the moving average is:Measuring Reliability, AVAILABILITY
- The formula for the moving average is:Learning Objectives, Capacity Planning
- The formula for the moving average is:Efficiency and Utilization, Evaluating Alternatives
- The formula for the moving average is:Evaluating Alternatives, Financial Analysis
- PROCESS SELECTION:Types of Operation, Intermittent Processing
- PROCESS SELECTION:Basic Layout Types, Advantages of Product Layout
- PROCESS SELECTION:Cellular Layouts, Facilities Layouts, Importance of Layout Decisions
- DESIGN OF WORK SYSTEMS:Job Design, Specialization, Methods Analysis
- LOCATION PLANNING AND ANALYSIS:MANAGING GLOBAL OPERATIONS, Regional Factors
- MANAGEMENT OF QUALITY:Dimensions of Quality, Examples of Service Quality
- SERVICE QUALITY:Moments of Truth, Perceived Service Quality, Service Gap Analysis
- TOTAL QUALITY MANAGEMENT:Determinants of Quality, Responsibility for Quality
- TQM QUALITY:Six Sigma Team, PROCESS IMPROVEMENT
- QUALITY CONTROL & QUALITY ASSURANCE:INSPECTION, Control Chart
- ACCEPTANCE SAMPLING:CHOOSING A PLAN, CONSUMER’S AND PRODUCER’S RISK
- AGGREGATE PLANNING:Demand and Capacity Options
- AGGREGATE PLANNING:Aggregate Planning Relationships, Master Scheduling
- INVENTORY MANAGEMENT:Objective of Inventory Control, Inventory Counting Systems
- INVENTORY MANAGEMENT:ABC Classification System, Cycle Counting
- INVENTORY MANAGEMENT:Economic Production Quantity Assumptions
- INVENTORY MANAGEMENT:Independent and Dependent Demand
- INVENTORY MANAGEMENT:Capacity Planning, Manufacturing Resource Planning
- JUST IN TIME PRODUCTION SYSTEMS:Organizational and Operational Strategies
- JUST IN TIME PRODUCTION SYSTEMS:Operational Benefits, Kanban Formula
- JUST IN TIME PRODUCTION SYSTEMS:Secondary Goals, Tiered Supplier Network
- SUPPLY CHAIN MANAGEMENT:Logistics, Distribution Requirements Planning
- SUPPLY CHAIN MANAGEMENT:Supply Chain Benefits and Drawbacks
- SCHEDULING:High-Volume Systems, Load Chart, Hungarian Method
- SEQUENCING:Assumptions to Priority Rules, Scheduling Service Operations
- PROJECT MANAGEMENT:Project Life Cycle, Work Breakdown Structure
- PROJECT MANAGEMENT:Computing Algorithm, Project Crashing, Risk Management
- Waiting Lines:Queuing Analysis, System Characteristics, Priority Model