 |
Production
and Operations Management
MGT613
VU
Lesson
32
INVENTORY
MANAGEMENT
Learning
Objectives
Inventory
Management is the procurement, use and
distribution of Inventory; some
text books use the
work
Inventory control for the
same concept. The word
control ensures that inputs,
the process itself
and
the
outputs are all manageable. This
inventory control concept helps us to
understand two important
concepts
of Operations Management i.e. Supply
Chain Management and Just In
Time Production
Systems.
In this lecture we will
study the ABC classification
System, Inventory Ordering
and Holding
Costs
and Economic Order Quantity
Model.
Key
Inventory Terms
The
Key Inventory Terms we
should know are Lead
time, Holding (carrying)
costs, Ordering ( Set
up)
Costs and Shortage(Stock out)
costs
1.
Lead time: Time interval
between ordering and receiving the
order.
2.
Holding (carrying) costs:
Cost to carry an item in
inventory for a length of
time, usually a year.
Costs
include Interest, insurance, taxes,
depreciation, obsolescence,
deterioration, pilferages,
breakage,
warehousing costs and Opportunity
costs. Holding (carrying)
costs: Holding costs
are
stated
in two ways
a.
Percentage of unit price
or
b.
Rupee
3.
Ordering costs: Costs of
ordering and receiving inventory.
These are the actual costs
that vary
with
the actual placement of the order.
4.
Shortage costs: Costs when
demand exceeds
supply.
ABC
Classification System
An
important aspect of Inventory
Management is that items held in
inventory are not of
equal
importance
in terms of rupees invested,
profit potential, sales or
usage volume.
ABC
Classification System controls
inventories by dividing items into 3
groups A, B and C
respectively.
1.
Group A consists of High
Rupee (Monetary) Value,
which account for a small
portion about
10%
of the total inventory
usage.
2.
Group B consists of Medium
Rupee (Monetary) Value,
which account for about
20% of the
total
inventory usage.
3.
Group C consists of Low
Rupee (Monetary) Value,
which account for a large
portion about
70%
of the total inventory
usage.
4.
The level of control reflects
cost benefit
concerns.
5.
Group A items are reviewed on a
regular basis.
6.
Group B items are reviewed at a
less frequency than Group A
items but more than Group
C
items.
7.
Group C items are not
reviewed and order is placed
directly.
147
Production
and Operations Management
MGT613
VU
Example.
Item
Dema
Unit
Annual
Classification
nd
Cost
Value
(
Rupees)
PC
10
Rs.20,000
200,000
B
( up to Rs.
500,000)
Monitor
5
5000
25,000
C(
Up to Rs.
50,000)
Processor
25
5000
125,000
B
RAM
1000
2000
2,000,000
A
Classify
inventory
according to ABC classification
system, Rupee value up to
50K and 500K
represent
C and B respectively.
Cycle
Counting
1.
A
physical count of items in
inventory.
2.
Cycle
counting management:
3.
How
much accuracy is
needed?
4.
When
should cycle counting be
performed?
5.
Who
should do it?
Economic
Order Quantity Models
1.
Economic order quantity
model
2.
Economic production
model
3.
Quantity discount
model
Assumptions
of EOQ Model
1.
Only
one product is involved.
2.
Annual
demand requirements known.
3.
Demand
is even throughout the year.
4.
Lead
time does not
vary.
5.
Each
order is received in a single
delivery.
6.
There
are no quantity discounts.
148
Production
and Operations Management
MGT613
VU
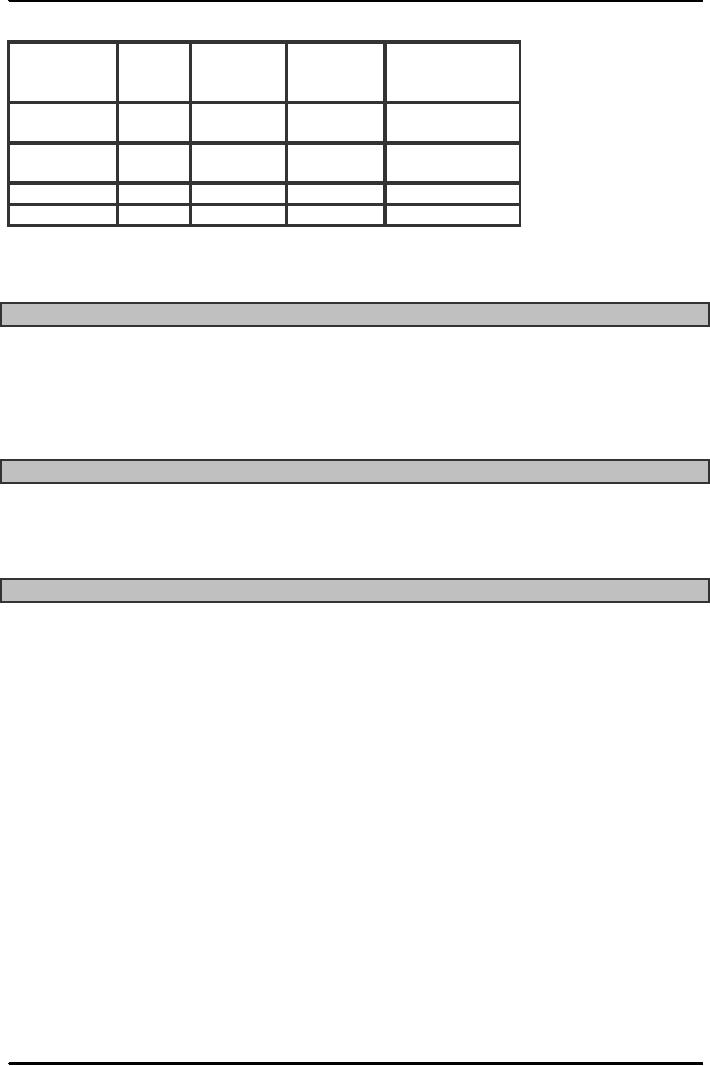
The
Inventory Cycle
Profile
of Inventory Level Over
Time
Q
Usage
rate
Quantity
on
hand
Reorder
point
Time
Place
Receive
Receive
Place
Receive
order
order
order
order
order
Lead
time
Total
Cost
Annual
Annual
carrying
ordering
+
Total
cost =
cost
cost
Q
D
S
H
TC
=
+
2
Q
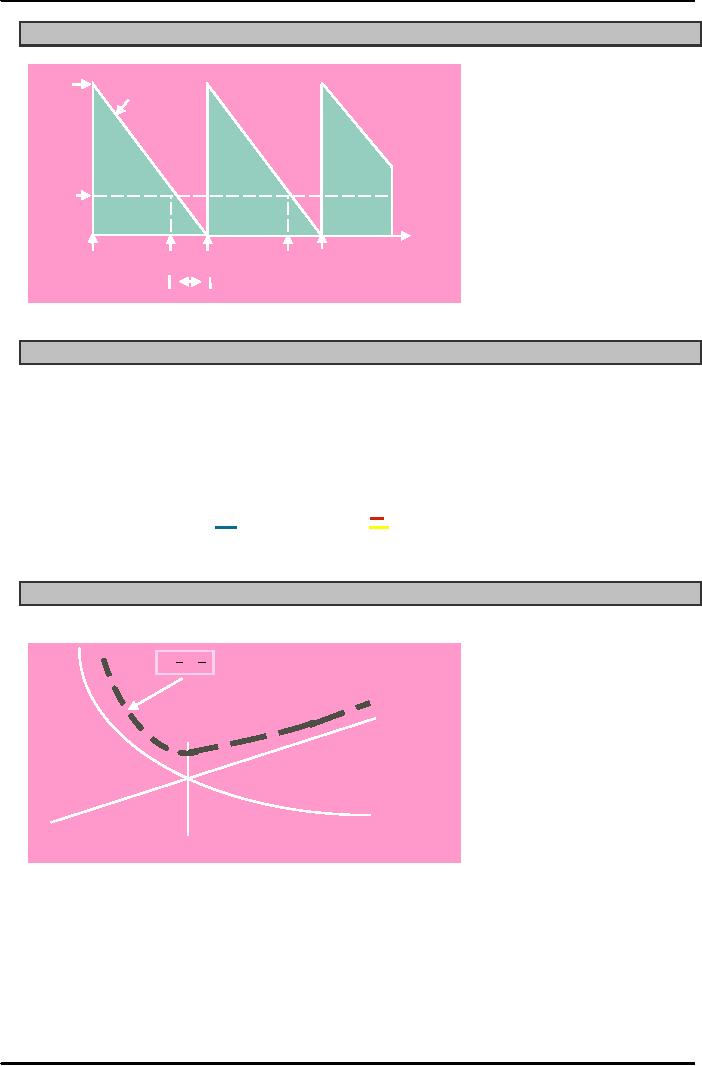
Cost
Minimization Goal
Q
D
TC
=
H+
S
A
2
Q
n
n
u
Holding
al
Costs
C
o
st
Ordering
Costs
Order
Quantity
QO(optimal order
quantity)
(Q)
149
Production
and Operations Management
MGT613
VU
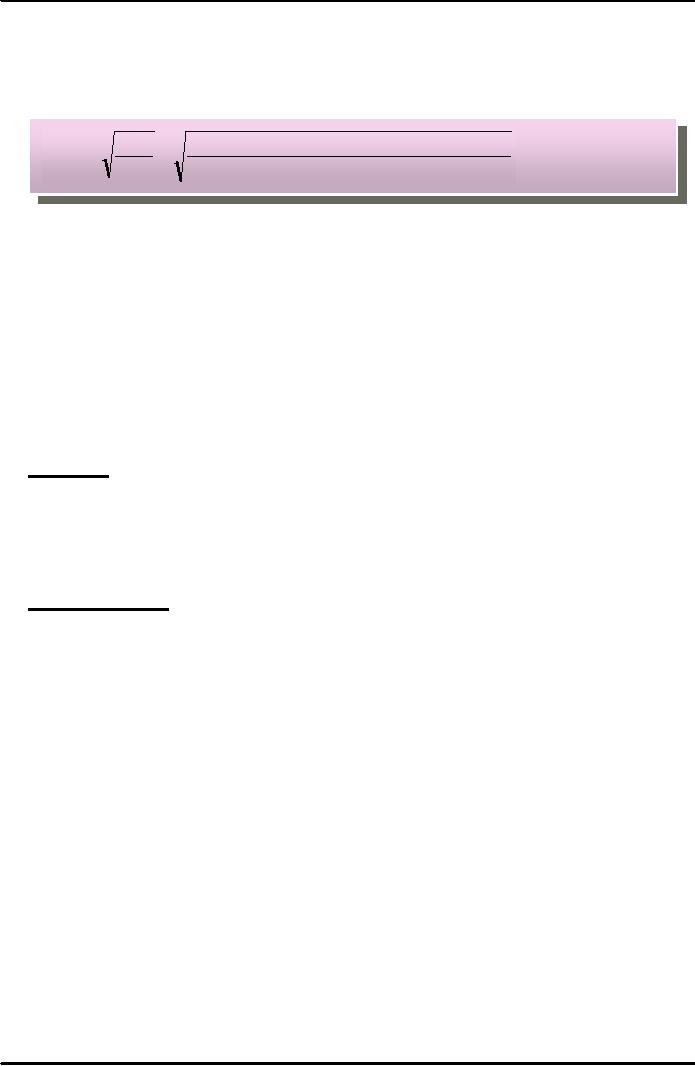
Deriving
the EOQ
Using
calculus, we take the derivative of the
total cost function and
set the derivative (slope)
equal
to
zero and solve for Q.
2DS
2(Annual
Demand)(O rder or Setup
Cost)
Q
OPT =
=
H
Annual
Holding Cost
Minimum
Total Cost
The
total cost curve reaches
its minimum where the carrying
and ordering costs are
equal.
Example
2
A
local distributor for an
international aerobic exercise machine manufacturer
expects to sell
approximate
10,000 machines. Annual
carrying cost is Rs. 2500
per machine and Order cost is
Rs.
10,000.
The distributor Operates 300
days a year.
1.
Find EOQ?
2.
The number of times the store will
reorder?
3.
Length of an Order
Cycle?
4.
Total Annual Cost if EOQ is
ordered?
Given
Data
D=10,000
machines.
H=
Annual carrying cost is Rs.
2500 per machine.
S=Order
cost is Rs. 10,000.
No
of The distributor Operates
300 days a year.
Calculation
of EOQ
Q0= Sq
Root of (2 DS)/H=
Sq
Root (2 X 10,000 X 10,000
)/2500
=Sq
Root (80,000)
=283
machines per year
The
number of times the store will
reorder?
D/Q0=10,000/283=35.34
=
35 Times
The
Length of an Order
Cycle
Q0/D=283/10.000=0.0283 of a year=
0.0283 X 300= 8.49
days
The
Total Annual Cost, if EOQ is
ordered
TC=
Carrying Cost + Ordering
Cost
=Q0/2 ( H) +
D/Q0 (S)
=283/2
(2500) + 10.000/283
(10,000)
=353,750
+ 353,353
=
Rs. 707,107
150

Production
and Operations Management
MGT613
VU
Summary
Inventory
Management is simply the procurement, use
and distribution of Inventory. In our
subsequent
discussions
on Inventory as well as Supply
Chain Management we will
find some similarities
between
the
two important concepts of
Inventory Management and Supply
Chain Management. When
we
combine
Inventory Management (Control)
with Production and Purchasing we are
more or less focusing
on
the Japanese Philosophy of Just In
Time Production. Also, the
basic EOQ Model minimizes the
sum
of
carrying or holding costs as
well as setup or ordering
cost.
151
Table of Contents:
- INTRODUCTION TO PRODUCTION AND OPERATIONS MANAGEMENT
- INTRODUCTION TO PRODUCTION AND OPERATIONS MANAGEMENT:Decision Making
- INTRODUCTION TO PRODUCTION AND OPERATIONS MANAGEMENT:Strategy
- INTRODUCTION TO PRODUCTION AND OPERATIONS MANAGEMENT:Service Delivery System
- INTRODUCTION TO PRODUCTION AND OPERATIONS MANAGEMENT:Productivity
- INTRODUCTION TO PRODUCTION AND OPERATIONS MANAGEMENT:The Decision Process
- INTRODUCTION TO PRODUCTION AND OPERATIONS MANAGEMENT:Demand Management
- Roadmap to the Lecture:Fundamental Types of Forecasts, Finer Classification of Forecasts
- Time Series Forecasts:Techniques for Averaging, Simple Moving Average Solution
- The formula for the moving average is:Exponential Smoothing Model, Common Nonlinear Trends
- The formula for the moving average is:Major factors in design strategy
- The formula for the moving average is:Standardization, Mass Customization
- The formula for the moving average is:DESIGN STRATEGIES
- The formula for the moving average is:Measuring Reliability, AVAILABILITY
- The formula for the moving average is:Learning Objectives, Capacity Planning
- The formula for the moving average is:Efficiency and Utilization, Evaluating Alternatives
- The formula for the moving average is:Evaluating Alternatives, Financial Analysis
- PROCESS SELECTION:Types of Operation, Intermittent Processing
- PROCESS SELECTION:Basic Layout Types, Advantages of Product Layout
- PROCESS SELECTION:Cellular Layouts, Facilities Layouts, Importance of Layout Decisions
- DESIGN OF WORK SYSTEMS:Job Design, Specialization, Methods Analysis
- LOCATION PLANNING AND ANALYSIS:MANAGING GLOBAL OPERATIONS, Regional Factors
- MANAGEMENT OF QUALITY:Dimensions of Quality, Examples of Service Quality
- SERVICE QUALITY:Moments of Truth, Perceived Service Quality, Service Gap Analysis
- TOTAL QUALITY MANAGEMENT:Determinants of Quality, Responsibility for Quality
- TQM QUALITY:Six Sigma Team, PROCESS IMPROVEMENT
- QUALITY CONTROL & QUALITY ASSURANCE:INSPECTION, Control Chart
- ACCEPTANCE SAMPLING:CHOOSING A PLAN, CONSUMER’S AND PRODUCER’S RISK
- AGGREGATE PLANNING:Demand and Capacity Options
- AGGREGATE PLANNING:Aggregate Planning Relationships, Master Scheduling
- INVENTORY MANAGEMENT:Objective of Inventory Control, Inventory Counting Systems
- INVENTORY MANAGEMENT:ABC Classification System, Cycle Counting
- INVENTORY MANAGEMENT:Economic Production Quantity Assumptions
- INVENTORY MANAGEMENT:Independent and Dependent Demand
- INVENTORY MANAGEMENT:Capacity Planning, Manufacturing Resource Planning
- JUST IN TIME PRODUCTION SYSTEMS:Organizational and Operational Strategies
- JUST IN TIME PRODUCTION SYSTEMS:Operational Benefits, Kanban Formula
- JUST IN TIME PRODUCTION SYSTEMS:Secondary Goals, Tiered Supplier Network
- SUPPLY CHAIN MANAGEMENT:Logistics, Distribution Requirements Planning
- SUPPLY CHAIN MANAGEMENT:Supply Chain Benefits and Drawbacks
- SCHEDULING:High-Volume Systems, Load Chart, Hungarian Method
- SEQUENCING:Assumptions to Priority Rules, Scheduling Service Operations
- PROJECT MANAGEMENT:Project Life Cycle, Work Breakdown Structure
- PROJECT MANAGEMENT:Computing Algorithm, Project Crashing, Risk Management
- Waiting Lines:Queuing Analysis, System Characteristics, Priority Model