 |
QUALITY CONTROL & QUALITY ASSURANCE:INSPECTION, Control Chart |
| << TQM QUALITY:Six Sigma Team, PROCESS IMPROVEMENT |
| ACCEPTANCE SAMPLING:CHOOSING A PLAN, CONSUMER’S AND PRODUCER’S RISK >> |
Production
and Operations Management
MGT613
VU
Lesson
27
QUALITY
CONTROL & QUALITY
ASSURANCE
Quality
Control or QC as it is popularly referred
as "is concerned with
quality of conformance of a
process".
The prime purpose of QC is to
assure that the processes
are performing in an
acceptable
manner.
Organizations accomplish QC by monitoring
process outputs using statistical
techniques. The
practical
and pragmatic QC based Operations
Strategy for a service or manufacturing
organization
would
focus on the principle of quality in
design.
Learning
Objectives
1.
Introduction
to Quality Control and
Assurance
2.
Phases
of Quality Control
3.
Elements
of Control Process
4.
How
control charts are used to
monitor a process and the
concepts that underlie their
use.
5.
Use
and interpret control
charts.
6.
Use
of run tests to check for
non randomness in process
output.
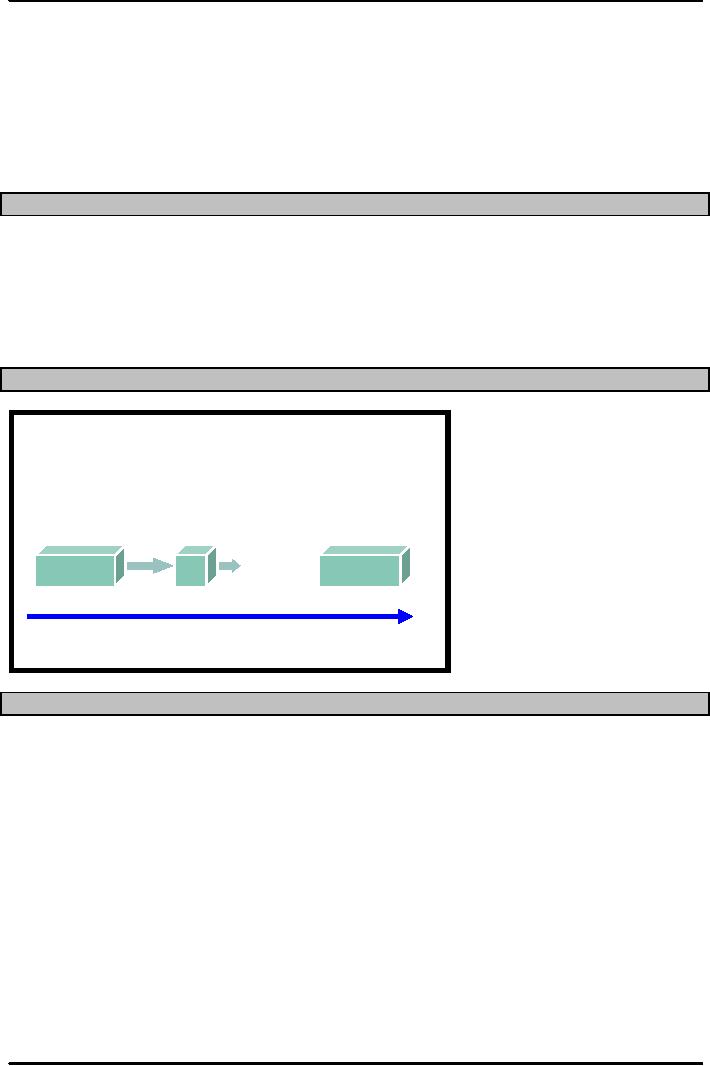
Phases
of Quality Assurance
Phases
of Quality Assurance
Inspection
Quality
built
Inspection
and
Before
/ after
into
the
Corrective
action
production
process
during
production
Pro
Continuous
Acceptance
ces
improvement
sampling
s
The
most
The
least
progressive
progressive
INSPECTION
Inspection
is an important strategy, in its simplest
form, is any method or device or
tactics used to
minimize
defects in products or services being
offered to the customers. As Operations
Manager we
should
be able to identify the following
four questions while considering
Inspection process.
1.
How Much/How Often
2.
Where/When
3.
Centralized vs. On-site
4.
Whether to inspect Variables or
Attributes.
An
important thing to remember is
that No inspection is necessary
for low value, high
volume products
like
common items like common pins, erasers or
pencils while automated inspection is
necessary for
high
value items. Automated inspection
may be necessary for even
high value, low volume items
as
well.
The word volume here refers
to quantity.
120
Production
and Operations Management
MGT613
VU
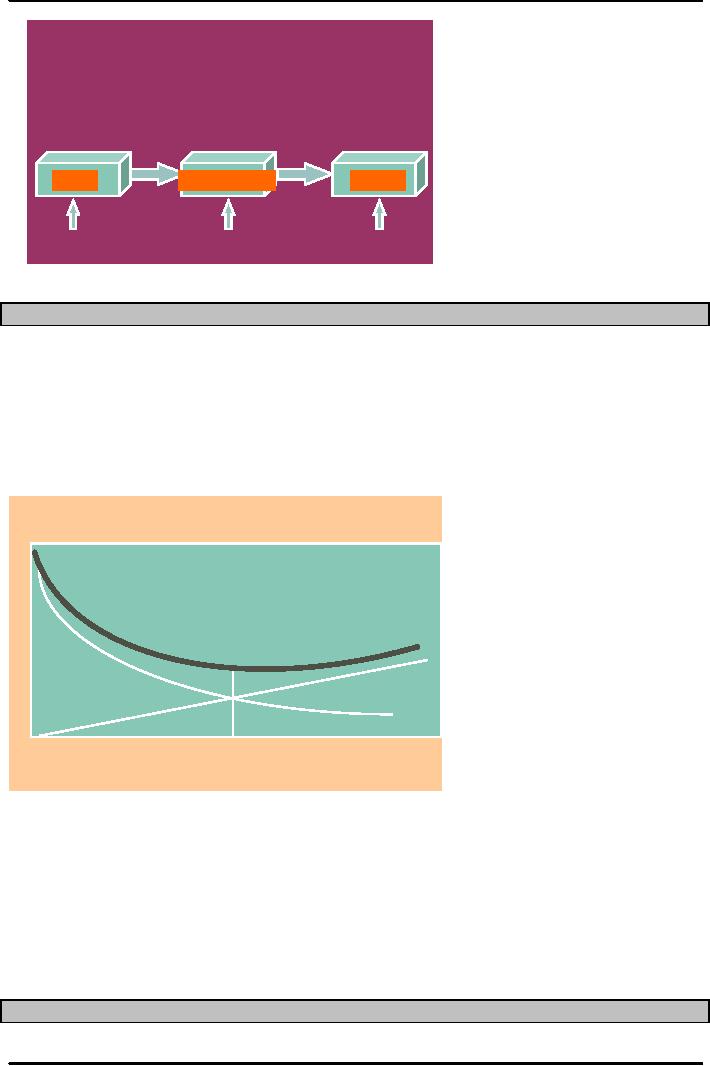
Input
Transformatio
Output
Acceptance
Acceptance
Process
sampling
sampling
control
INSPECTION
COSTS FOR HOW MUCH/HOW
OFTEN
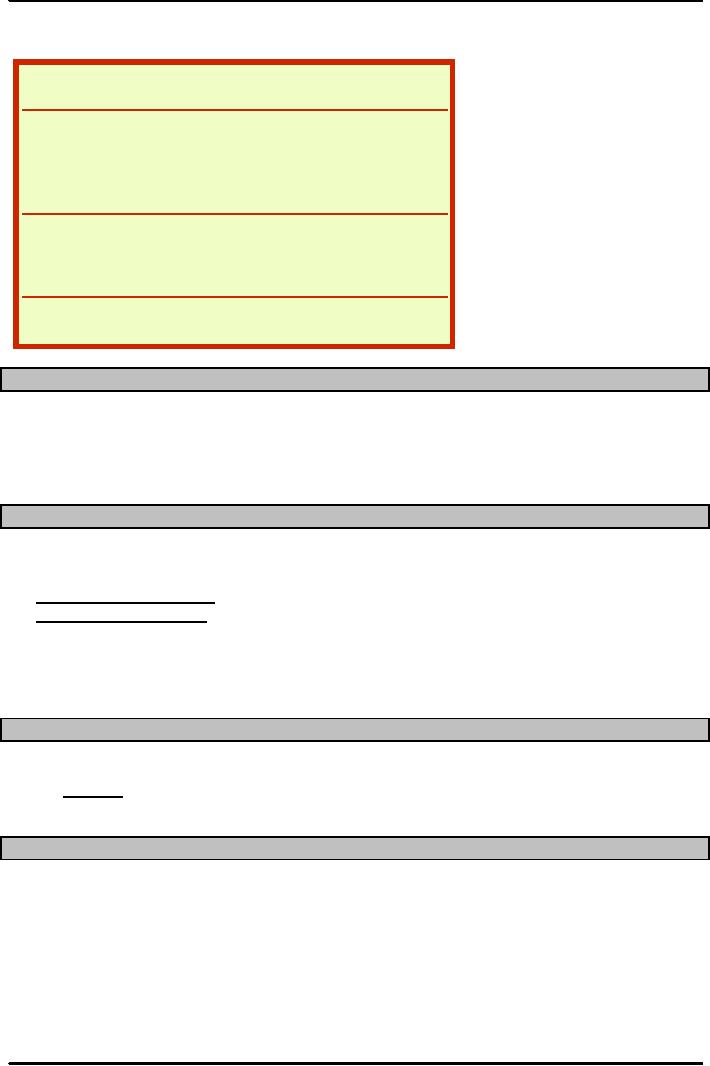
The
graph on the next page
shows the relationship between
amount of inspection required
and
costs
incurred in carrying out such
inspection.
1.
With increase in Inspection
activities the cost of undetected
defectives decreases.
2.
With increase in inspection
activities the cost of inspection
increases.
We
need to observe for Total
cost function curve which
shows high costs at no
inspection and gradually
comes
down and reaches a minimum
value at the optimal amount of inspection
and then start
increases.
C
O
S
T
Optimal
Amount
of Inspection
Inspection
Costs for How Much/How
Often
1.
Where to Inspect
in the Process
2.
Raw materials and purchased
parts ( DO not purchase poor
quality products)
3.
Finished products ( Poor products returned by
customers can also lead to
additional shipping
costs)
4.
Before a costly operation ( Do
not waste Resources of Man,
Material and Machine)
5.
Before an irreversible process (
Pottery, Ceramics, Tiles, PC chips,
glass filaments)
6.
Before a covering process (
Before painting, plating and
assembly)
EXAMPLES
OF INSPECTION POINTS IN SERVICE
INDUSTRY
121
Production
and Operations Management
MGT613
VU
We
cannot have same inspection points
for the service industry, infact we
need to pay attention to
the
type
of industry or business in which a
service organization competes. Please
refer to the table on the
next
page and note the difference
in characteristics and location of
inspection points.
Type
of
Inspection
Characteristics
business
points
Fast
Food
Cashier
Accuracy
Counter
area Appearance,
productivity
Eating
area
Cleanliness
Building
Appearance
Kitchen
Health
regulations
Safe,
well lighted
Hotel/motel
Parking lot
Accuracy,
timeliness
Accounting
Appearance,
safety
Building
Waiting
times
Main
desk
Supermarket
Cashiers
Accuracy,
courtesy
Deliveries
Quality,
quantity
CENTRALIZED
VS ONSITE INSPECTION
1.
Inspection of Ships, Nuclear Plants,
Petroleum Refinery, Chemical
Plant equipments for
cracks,
brittle
fracture etc both external
and internal inspection.
2.
Lab tests include blood
tests, material
testing
QUALITY
CONTROL IN TERMS OF STATISTICAL
PROCESS CONTROL:
We
now focus on the idea of Quality
Control in terms of Statistical
Process Control, for this we
need to
define
Statistical
Process Control:
Statistical evaluation of the output of a
process during
production
Quality
of Conformance: A
product or service conforms to
specifications
Which
Characteristics can be controlled: Only
those characteristics which
can be counted or
measured.
Main
Task of QC: is to distinguish random
from non random variability,
because non random
variability
indicates that the process is out of
control
Control
Chart
Control
Chart: A time ordered plot representative
sample statistics obtained
from an on going
process
(e.g. sample means)
Purpose: to
monitor process output to
see if it is random
Upper
and lower control limits
define the range of acceptable
variation
CONTROL
CHART & STATISTICAL PROCESS
CONTROL
122
Production
and Operations Management
MGT613
VU
Out
of
Abnormal
variation
contro
due
to assignable
UC
Mea
Normal
variation
LC
Abnormal
variation
due
to assignable
0
1
2
3
4
5
6
7
8
9
10
11 12 13 14 15
Sample
Statistical
Process Control
The
essence of statistical process
control is to assure that the
output of a process is random so
that
future
output will
be random.
Statistical
Process Control
The
Control Process consists of the
following important
stages.
1.
Define
2.
Measure
3.
Compare
4.
Evaluate
5.
Correct
6.
Monitor results
Variations
and Control
�Random
variation:
Natural variations in the output of a
process, created by countless
minor factors
Also
called COMMON/ CHANCE.
INHERENT and part of the process.
E.g. Difference between
old
and
new machines.
�Assignable
variation: A
variation whose source can
be identified
SAMPLING
DISTRIBUTION
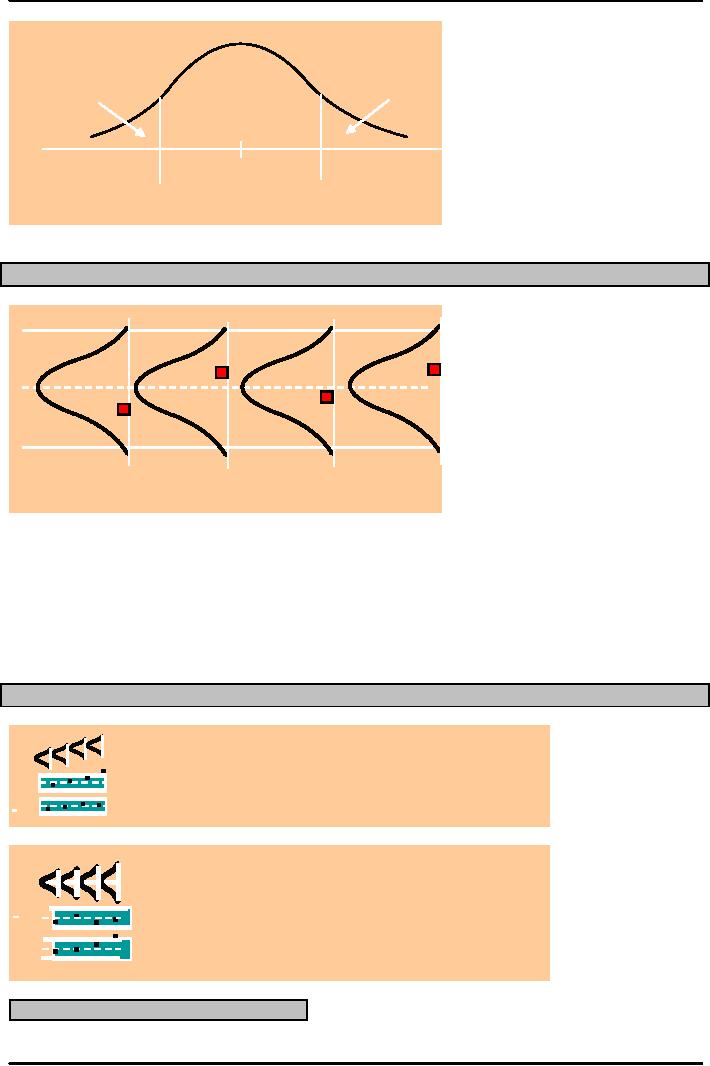
The
variability of a sample statistic can be
described by its SAMPLING
DISTRIBUTION. The goal
of
sampling
is to determine whether non random
/assignable/ correctable sources of variation
are present in
the
output of the process. E.g.
Soft drinks bottle are
never 250 ML. slight
differences among the mean.
SAMPLING
DISTRIBUTION
Sampling
distribution
Process
distribution
Mean
NORMAL
DISTRIBUTION
123
Production
and Operations Management
MGT613
VU
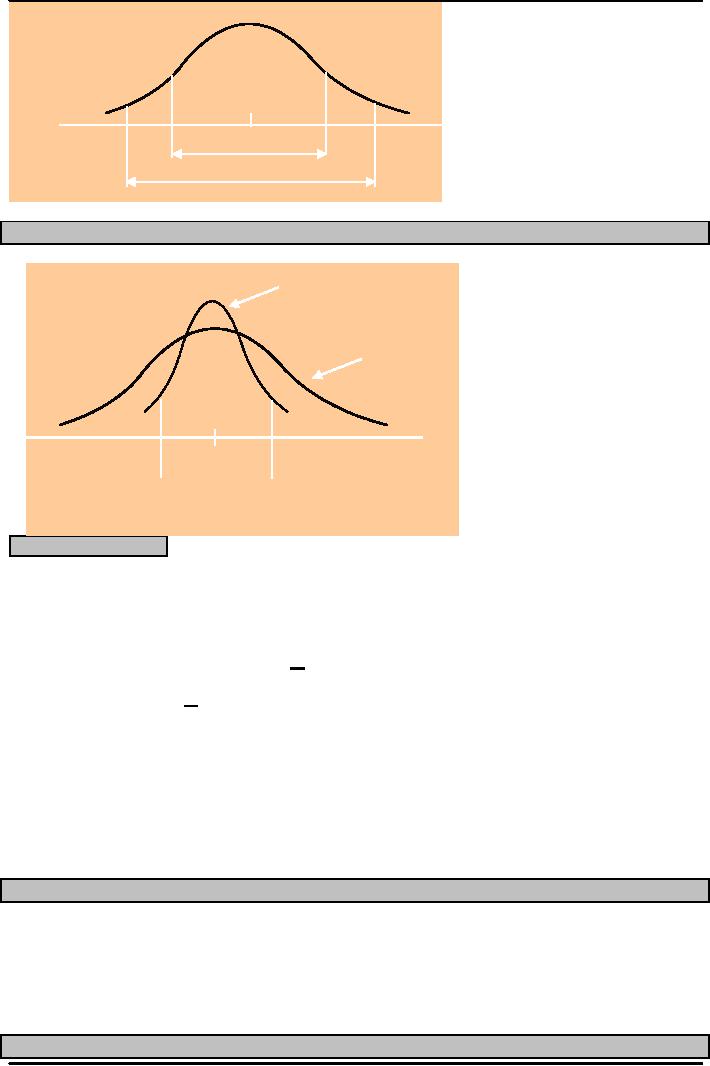
σ
= Standard
deviation
-3σ
-2σ
+2σ
+3σ
Mean
95.44%
99.74%
CONTROL
LIMITS
Sampling
distribution
Process
distribution
Mean
Lower
Upper
contro
contro
l
l
CONTROL
CHARTS
A
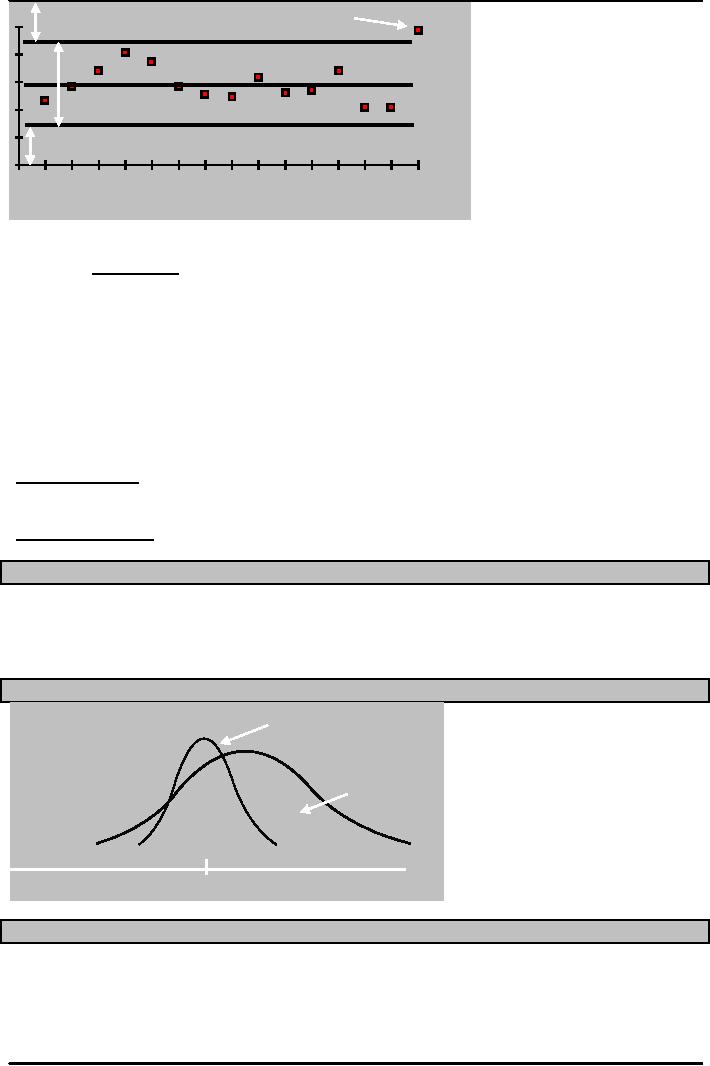
control chart is a time ordered plot of
sample statistics.
It
is used to distinguish between random
variability and non random
variability.
The
basis of control chart is sample
distribution which essentially
describes random variability.
Theoretically
any value is possible as the distribution
extends to infinity.
99.7%
of all values will be within
+
3 standard
deviations
Control
Charts
We
draw a line at + 3 and call it
control chart limits and observe
any value beyond this to be
out
of
limits.
Control
Chart limits are the
dividing lines between random deviations
and mean of the
distribution
and non random deviations and mean of the
distribution.
The
limits that separate random
variations from non random
variations is known as UCL
and
LCL.
A
sample statistic that falls between
UCL and LCL suggests ( does
not proves) randomness and a
value
outside
suggests ( does not proves) no
randomness.
SPC
Errors
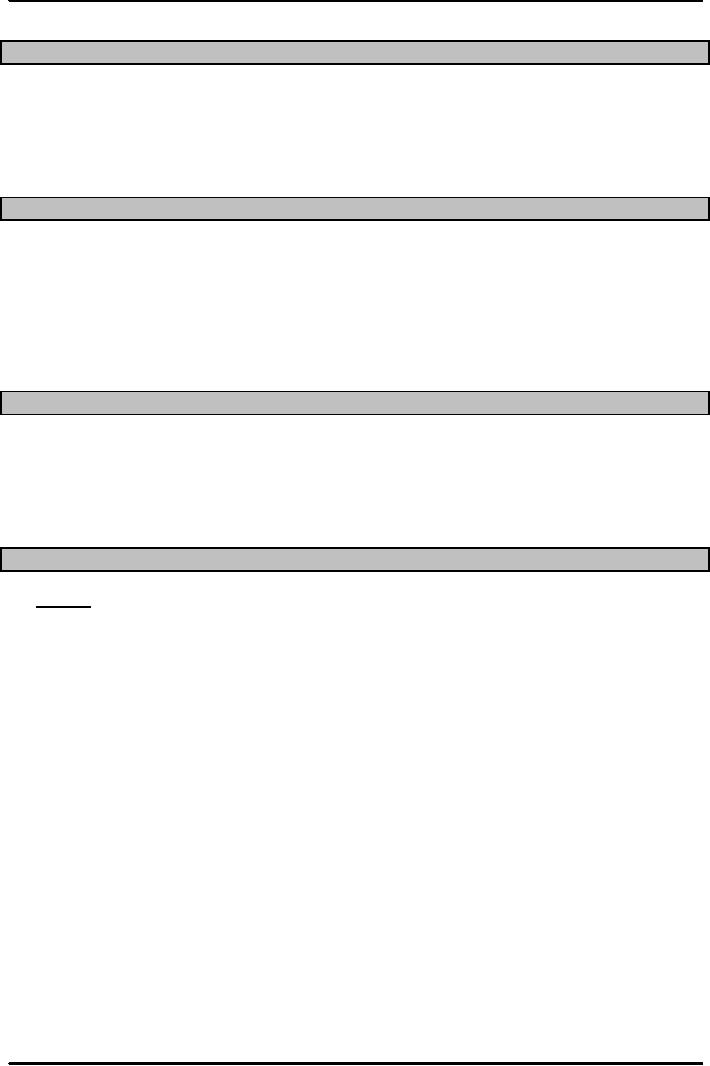
Type
I error: Concluding a process is
not in control when it
actually is or concluding that
no
randomness
is present when it is only
randomness that is
present.
Type
II error: Concluding a process is in
control when it is not that
no randomness is not
present
when
it is present.
Type
I Error
124
Production
and Operations Management
MGT613
VU
α/
α/
Mean
LC
UC
α
= Probabilit
y
OBSERVATIONS
FROM SAMPLE
DISTRIBUTION
UCL
LCL
1
2
3
4
Sample
number
Control
Charts for Variables
Mean
control charts
Used
to monitor the central tendency of a
process.
X
bar charts
Range
control charts
Used
to monitor the process dispersion
R
charts
MEAN
AND RANGE CHARTS
(process
mean is
shiftingupward)
Sampling
Distribution
UCL
Detects
shift
L
C
L
UCL
R-chart
Does
not detect shift
x-Chart
L
C
L
Sampling
Distribution
(process
variability is increasing)
UCL
Does
not
x-Chart
LC
reveal
increase
L
UCL
R-chart
Reveals
increase
L
C
L
CONTROL
CHART FOR
ATTRIBUTES
p-Chart
- Control chart used to monitor the
proportion of defectives in a
process
125
Production
and Operations Management
MGT613
VU
c-Chart
- Control chart used to monitor the
number of defects per unit
Use
of p-Charts
When
observations can be placed into two
categories.
Good
or bad
Pass
or fail
Operate
or don't operate
When
the data consists of multiple
samples of several observations
each
Use
of c-Charts
Use
only when the number of occurrences per
unit of measure can be
counted; non-occurrences
cannot
be counted.
Scratches,
chips, dents, or errors per
item
Cracks
or faults per unit of
distance
Breaks
or Tears per unit of
area
Bacteria
or pollutants per unit of
volume
Calls,
complaints, failures per unit of
time
Use
of Control Charts
At
what point in the process to
use control charts
What
size samples to take
What
type of control chart to
use
1.
Variables
2.
Attributes
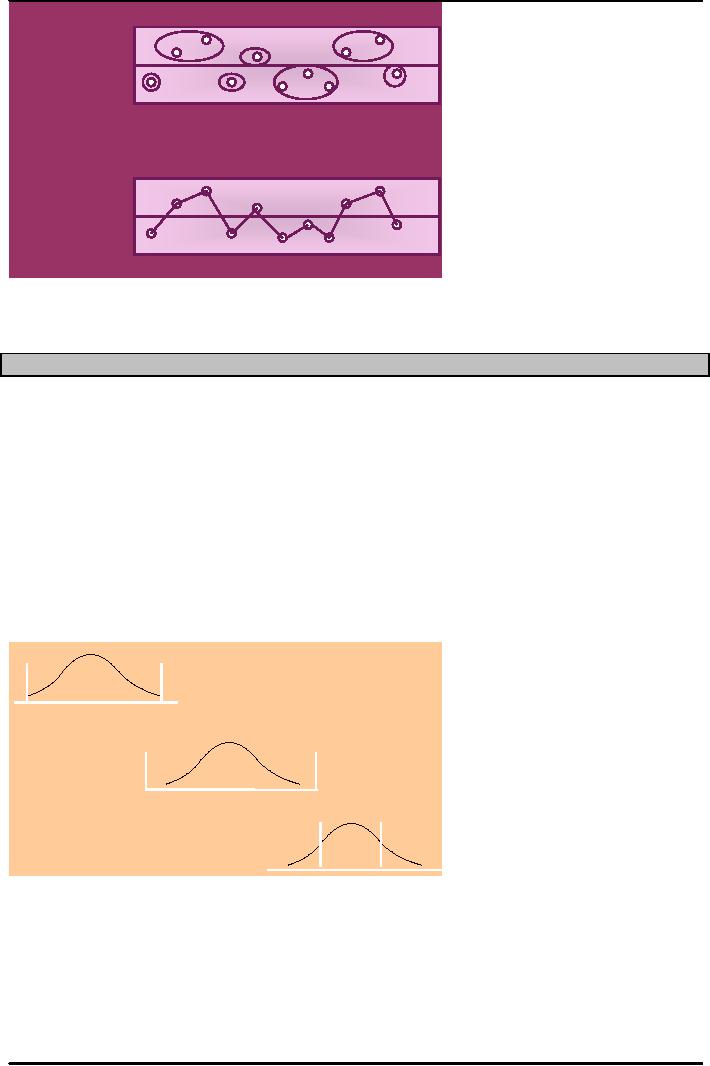
RUN
TESTS
Run
test a
test for randomness
Any
sort of pattern in the data would
suggest a non-random
process
All
points are within the
control limits - the process
may not be random
Nonrandom
Patterns in Control
charts
Trend
Cycles
Bias
Mean
shift
Too
much dispersion
Counting
Runs
126
Production
and Operations Management
MGT613
VU
Counting
Above/Below Median
Runs
(7
B A
A
B
A
B
B
B A
A
Counting
Up/Down Runs
(8
U
U
D
U
D
U D U U
Underlining
each runs helps in counting
IN
case of Ups and Down the
first value does not
receives either a U or D because
nothing precedes it.
PROCESS
CAPABILITY
Tolerances
or specifications is the range of acceptable values
established by engineering design
or
customer requirements
Process
variability: is the natural variability
in a process
Process
capability: is the process variability
relative to specification
Process
Capability is thus more importantly
related to our discussion of
Quality Control and
Quality
Assurance
and we will take up three cases in
detail to understand this important
concept.
1.
In Case A we observe that
process specifications and
output are matched.
2.
In Case B process variability is
well within the process
specification and output.
3.
In Case C, we need to check
whether a process is capable of meeting
specifications and not
just
use
a control chart.
Lower
Upper
Specificatio
Specificatio
A.
Process variability
matches
specifications
Lower
Upper
Specificatio
Specificatio
B.
Process variability
Lower
Upper
well
within specifications Specificatio
Specificatio
Process
Capability
Case
C, A manager in case C can
take the following
steps.
1.
Redesign the process to obtain the desired
output.
2.
Use an alternative process to
obtain the desired output.
3.
Retain the current process
but attempt to eliminate output
using 100 percent
inspection
4.
Examine the specifications to see if
they are necessary or can be
relaxed
127
Production
and Operations Management
MGT613
VU
Process
Variability is the key factor in
Process Capability. It is measured in
terms of process
standard
deviation.
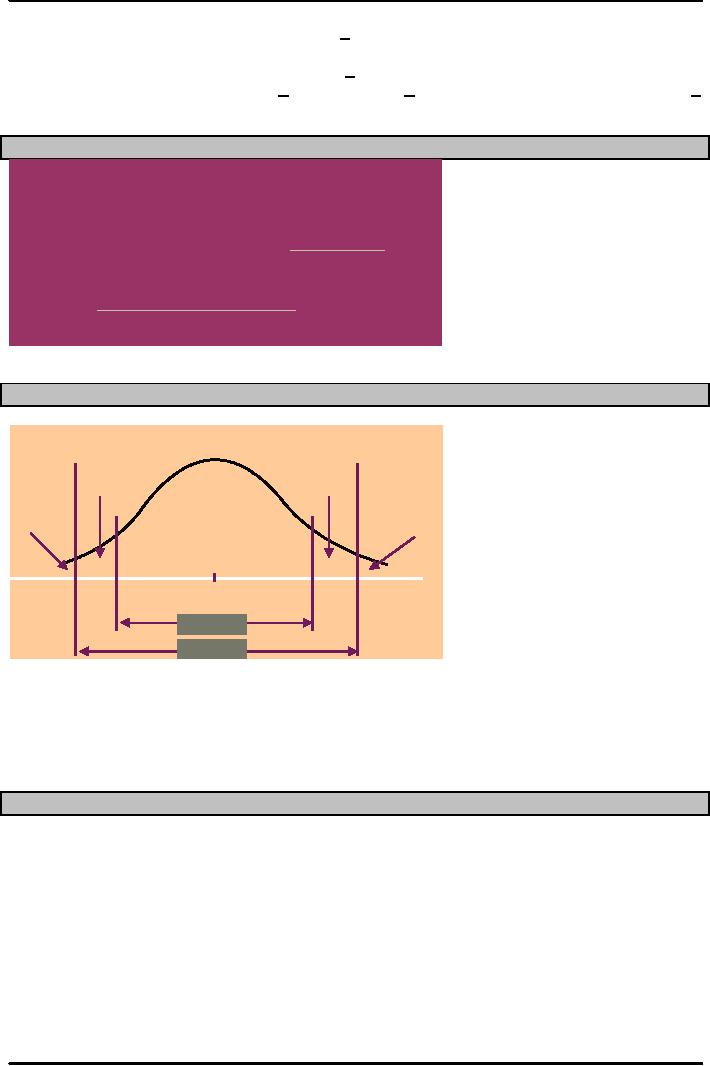
Process capability is considered to be + 3 Standard
Deviations from the process
mean. E.g.
An
insurance company provides a service of
registering a new membership ( filling of
form) in 10 mins,
acceptable
range of variation around the time is + 1
minute, the process has a
standard deviation of
0.5min.It
would not be capable because + 3
SDs would be + 1.5 Mins,
exceeding the specification of +
1
minute.
Process
Capability Ratio
Specification
width
Process
capability ratio, Cp =
Process
width
Upper
specification lower specification
Cp=
6σ
3
SIGMA AND 6 SIGMA
QUALITY
Upper
Lower
specification
specification
1350
ppm
1350
ppm
1.7
ppm
1.7
ppm
Process
mean
+/-
3 Sigma
+/-
6 Sigma
Improving
Process Capability
1.
Simplify
2.
Standardize
3.
Mistake-proof ( Poka Yoke)
4.
Upgrade equipment
5.
Automate
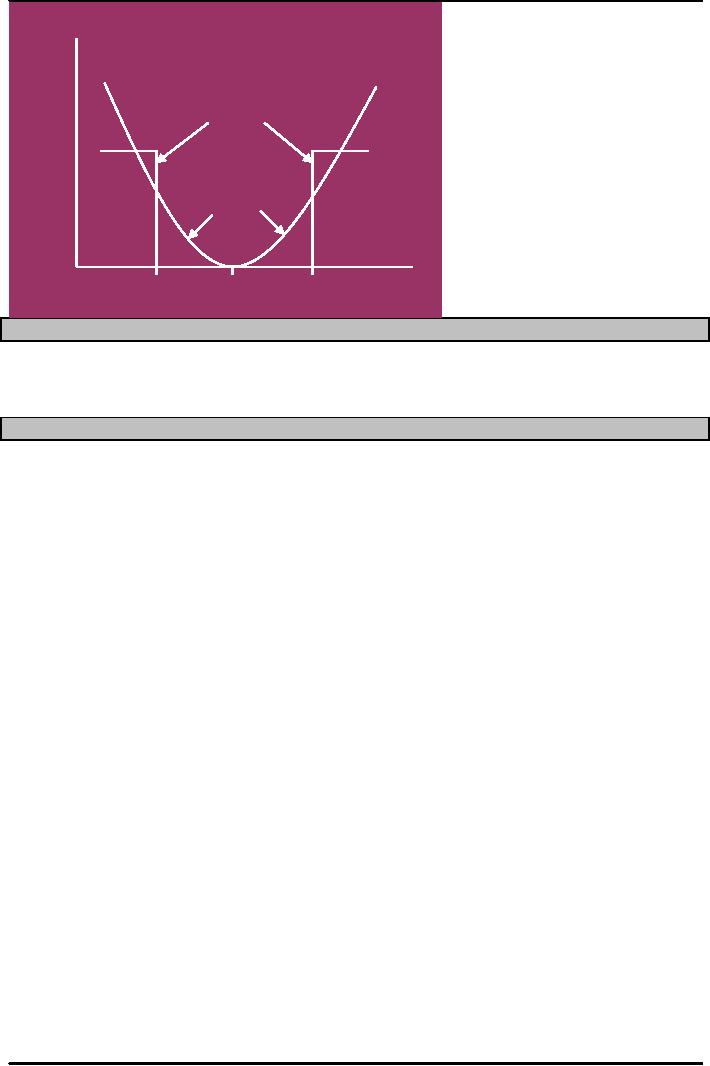
Taguchi
Loss Function
128
Production
and Operations Management
MGT613
VU
Traditional
cost
Cost
Taguchi
cost
Lowe
Uppe
Target
r
r
Limitations
of Capability Indexes
1.
Process may not be
stable
2.
Process output may not be
normally distributed
3.
Process not centered but
Cp is used
OPERATIONS
STRATEGY WRT Q/C
It
is neither necessary nor desirable to
use Control charts for
every production
process.
Some
processes are highly stable
and do not require Control
Charts.
Managers
should use Control Charts on
processes that go out of
control.
Use
control Charts for new
processes till they obtain
stable results.
Judicious
use of SPC will ensure
detection of departures from
randomness in a process.
129
Table of Contents:
- INTRODUCTION TO PRODUCTION AND OPERATIONS MANAGEMENT
- INTRODUCTION TO PRODUCTION AND OPERATIONS MANAGEMENT:Decision Making
- INTRODUCTION TO PRODUCTION AND OPERATIONS MANAGEMENT:Strategy
- INTRODUCTION TO PRODUCTION AND OPERATIONS MANAGEMENT:Service Delivery System
- INTRODUCTION TO PRODUCTION AND OPERATIONS MANAGEMENT:Productivity
- INTRODUCTION TO PRODUCTION AND OPERATIONS MANAGEMENT:The Decision Process
- INTRODUCTION TO PRODUCTION AND OPERATIONS MANAGEMENT:Demand Management
- Roadmap to the Lecture:Fundamental Types of Forecasts, Finer Classification of Forecasts
- Time Series Forecasts:Techniques for Averaging, Simple Moving Average Solution
- The formula for the moving average is:Exponential Smoothing Model, Common Nonlinear Trends
- The formula for the moving average is:Major factors in design strategy
- The formula for the moving average is:Standardization, Mass Customization
- The formula for the moving average is:DESIGN STRATEGIES
- The formula for the moving average is:Measuring Reliability, AVAILABILITY
- The formula for the moving average is:Learning Objectives, Capacity Planning
- The formula for the moving average is:Efficiency and Utilization, Evaluating Alternatives
- The formula for the moving average is:Evaluating Alternatives, Financial Analysis
- PROCESS SELECTION:Types of Operation, Intermittent Processing
- PROCESS SELECTION:Basic Layout Types, Advantages of Product Layout
- PROCESS SELECTION:Cellular Layouts, Facilities Layouts, Importance of Layout Decisions
- DESIGN OF WORK SYSTEMS:Job Design, Specialization, Methods Analysis
- LOCATION PLANNING AND ANALYSIS:MANAGING GLOBAL OPERATIONS, Regional Factors
- MANAGEMENT OF QUALITY:Dimensions of Quality, Examples of Service Quality
- SERVICE QUALITY:Moments of Truth, Perceived Service Quality, Service Gap Analysis
- TOTAL QUALITY MANAGEMENT:Determinants of Quality, Responsibility for Quality
- TQM QUALITY:Six Sigma Team, PROCESS IMPROVEMENT
- QUALITY CONTROL & QUALITY ASSURANCE:INSPECTION, Control Chart
- ACCEPTANCE SAMPLING:CHOOSING A PLAN, CONSUMER’S AND PRODUCER’S RISK
- AGGREGATE PLANNING:Demand and Capacity Options
- AGGREGATE PLANNING:Aggregate Planning Relationships, Master Scheduling
- INVENTORY MANAGEMENT:Objective of Inventory Control, Inventory Counting Systems
- INVENTORY MANAGEMENT:ABC Classification System, Cycle Counting
- INVENTORY MANAGEMENT:Economic Production Quantity Assumptions
- INVENTORY MANAGEMENT:Independent and Dependent Demand
- INVENTORY MANAGEMENT:Capacity Planning, Manufacturing Resource Planning
- JUST IN TIME PRODUCTION SYSTEMS:Organizational and Operational Strategies
- JUST IN TIME PRODUCTION SYSTEMS:Operational Benefits, Kanban Formula
- JUST IN TIME PRODUCTION SYSTEMS:Secondary Goals, Tiered Supplier Network
- SUPPLY CHAIN MANAGEMENT:Logistics, Distribution Requirements Planning
- SUPPLY CHAIN MANAGEMENT:Supply Chain Benefits and Drawbacks
- SCHEDULING:High-Volume Systems, Load Chart, Hungarian Method
- SEQUENCING:Assumptions to Priority Rules, Scheduling Service Operations
- PROJECT MANAGEMENT:Project Life Cycle, Work Breakdown Structure
- PROJECT MANAGEMENT:Computing Algorithm, Project Crashing, Risk Management
- Waiting Lines:Queuing Analysis, System Characteristics, Priority Model