 |
Production
and Operations Management
MGT613
VU
Lesson
17
In
our earlier lectures we talked
about importance of capacity
planning along with the idea
that capacity
planning
decisions are carried out
with certain objectivity in
mind both at the individual
level as well as
at
the organizational level. We also
learnt the various measures of
capacity. We now focus our
attention
on
various alternatives available to us
along with cost volume
relationship.
Evaluating
Alternatives
Minimum
Average Cost per
Unit
Average
cost
per
unit
Minimum
Cost
0
Rate
of output
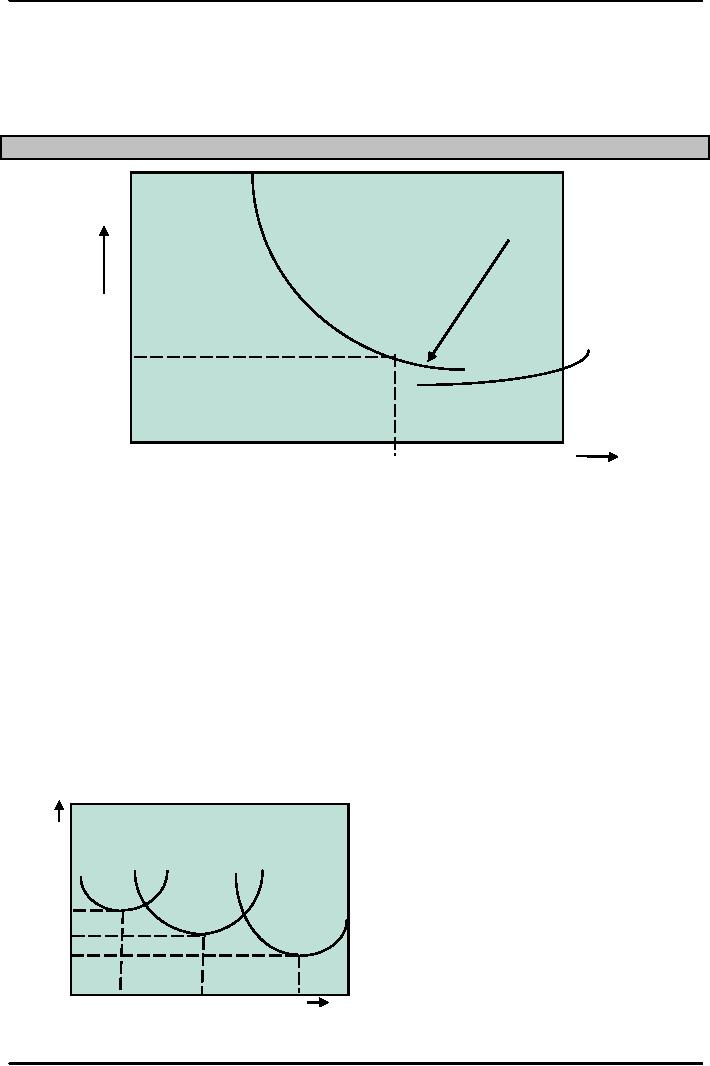
Explanation
of the Cost Curve
The
explanation for the shape of
the cost curve is that
low levels of output
(Production), the costs of
facilities
and equipment must be absorbed
(paid for) by few units.
Hence the cost per unit is very
high.
As
the output is increased, there are more
units to absorb the fixed
cost of utilities, facilities
and
equipment,
so unit cost is
decreased.
Minimum
Cost would be recorded at the
optimal rate, beyond that the
unit cost will
start
to increase. Other factors now
become more important which
include worker fatigue,
equipment
breakdown,
the loss of flexibility, which
leaves less margin for
error and increases
difficulty in
coordinating
activities.
Evaluating
Alternatives
Minimum
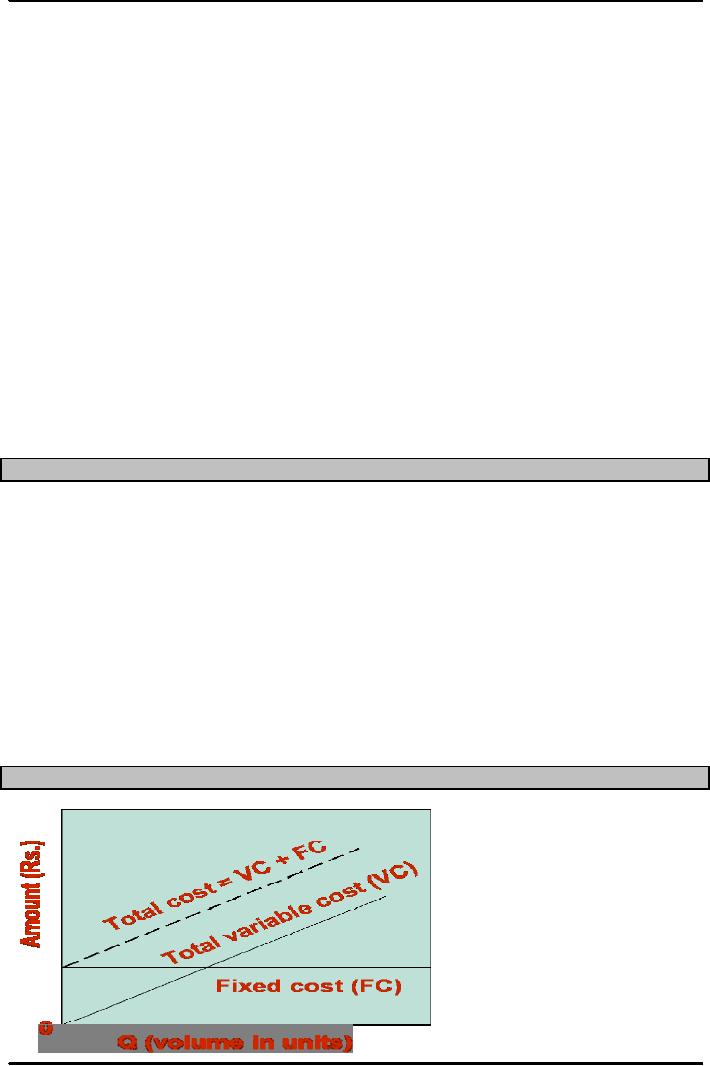
cost & optimal operating rate are
functions of size of
production
unit.
Average
cost per unit
Small
Medium
plant
plant
Large
plant
0
Output
rate
72
Production
and Operations Management
MGT613
VU
Evaluating
Alternatives
As
the general capacity of the plant
increases, the optimal
output rate increases and
the
minimum
cost for the optimal rate
decreases. This is the prime
reason why larger plants
tend to
have
higher optimal output rates
and lower minimum costs than
smaller plants. The senior
management
normally takes in to account the
same considerations in addition to
availability of
financial,
capital resources and
forecasted demand.
The
important step is to determine
enough points for each
size facility to be able to
make a
comparison
among different sizes. In some
industries or types of services, facility
sizes are
given,
where as in other facility size
are continuous variable.
Occasionally the management
decides
for a size which does
not have the desired rate of output. E.g.
Pharmaceutical Company,
oil
field, gas fields.
An
organization needs to examine the
alternatives for future
capacity from a number of
different
perspectives.
Economic Conditions set the
external conditions which
influence the following
5.
Will Alternative be
feasible.
6.
How much will it
cost?
7.
How soon can we have
it?
8.
What will be the operating and
maintenance costs?
Possible
Negative Opinion due to the following
decisions.
4.
Decision to build a new
power plant, nuclear, coal,
geothermal
5.
Displacement of people if a new hydro
plant is to be built.
6.
Environmental issues related to
company's new
project.
Planning
Service Capacity
Services
are different that
manufacturing cant be inventoried
while services cannot be inventoried,
this
reason
alone makes it necessary and
pertinent to plan for service
capacity.
Need
to be near customers as Capacity
and location are closely
tied.
Inability
to store services as Capacity
must be matched with timing
of demand
Degree
of volatility of demand it can
vary between peak and low periods.
Cost-Volume
Relationships
73
Production
and Operations Management
MGT613
VU
Assumptions
of Cost-Volume Analysis
1.
One
product is involved
2.
Everything
produced can be sold
3.
Variable
cost per unit is the same
regardless of volume
4.
Fixed
costs do not change with
volume
5.
Revenue
per unit constant with
volume
6.
Revenue
per unit exceeds variable
cost per unit
Cost
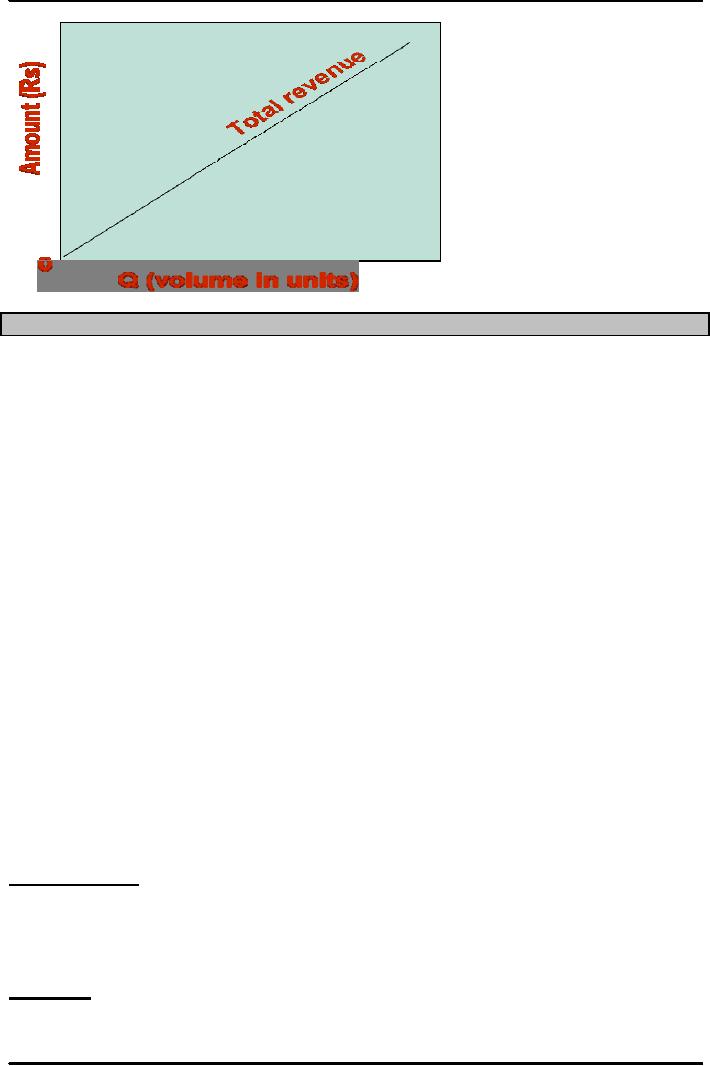
Volume Relationship focuses on
relationships between costs, revenue and
volume of output. The
primary
purpose of cost volume analysis is to
estimate the income of an organization
under different
operating
conditions. It is particularly useful as
a tool for comparing
capacity alternatives.
The
application of Cost Volume
Relationships requires identification of
all costs related to
the
production
of a given product. These
costs are assigned to fixed
costs or variable
costs.
Fixed
costs tend to remain
constant regardless of volume of
output. Examples include Rental
costs,
property
taxes, equipment costs,
heating and cooling expenses, and
certain administration
costs.
Variable
costs vary directly with
volume of output. The major
portions of variable cost
are materials
and
labor cost. For our analysis
part we can assume that the
variable cost per unit
remains the same
regardless
of volume of output.
Let
us construct the model for Cost
Volume Relationship. If we select FC ,
VC, TC, TR R , Q, QBEP , P
and
R to represent Fixed Cost,
Variable Cost, Total Cost,
Total Revenue, Revenue per unit, Quantity
or
Volume
of Output, Quantity or Volume of
Output at BREAK EVEN and
Profit respectively
then
Step
I
The
total cost TC associated
with a given volume of
output is equal to the sum of the
fixed cost FC and
the
Variable Cost per
Unit
TC=
FC+ VC X Q
Step
II
Revenue
per unit, like variable cost
per unit, is assumed to be the same
regardless of the quantity of
output.
Total Revenue will have a linear
relationship with the
output.
TR=
R X Q
Cost-Volume
Relationships
Step
III
74
Production
and Operations Management
MGT613
VU
Profit
is P difference between Revenue TR and
Costs TC. Construct the model
for Cost Volume
Relationship
P=
TR-TC
P=
R X Q (FC + VC X Q)
Rearranging
and factorizing
P=Q
( R-VC) FC
Or
P + FC= Q ( R-VC)
Also
Q = ( P +FC)/ (R-VC)
Q=
Quantity or Volume of
Output
QBEP=
Quantity or Volume of Output at
BREAK EVEN, would be
where
P=Profit
is 0
So
QBEP = FC/ R-VC
Cost-Volume
Relationships
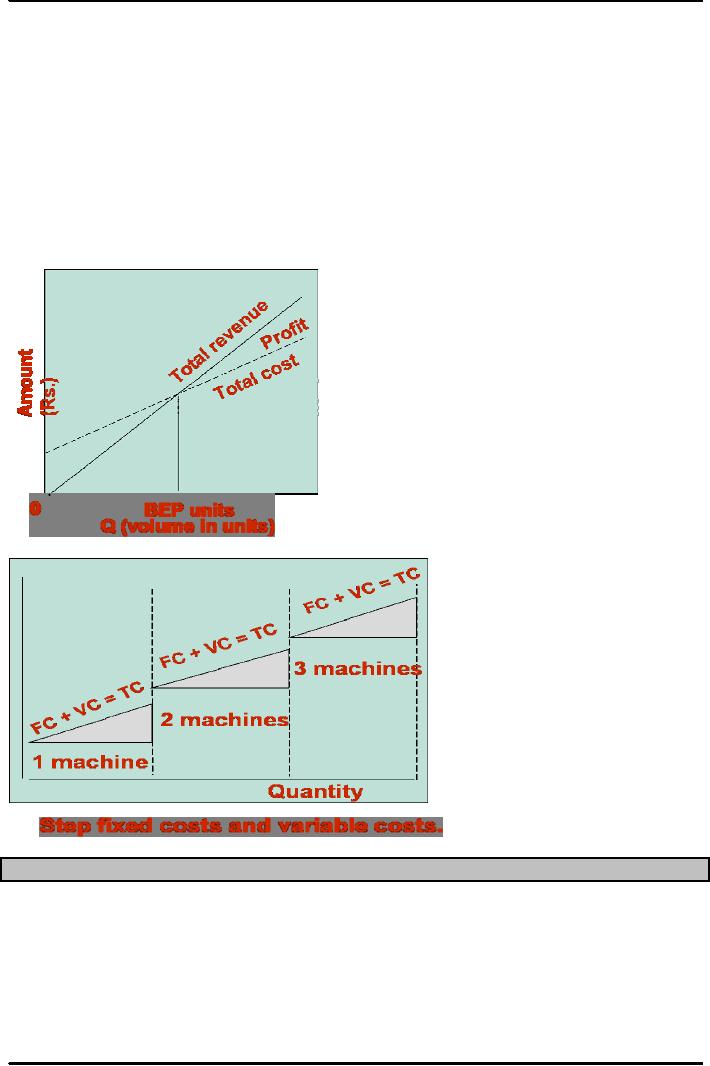
Capacity
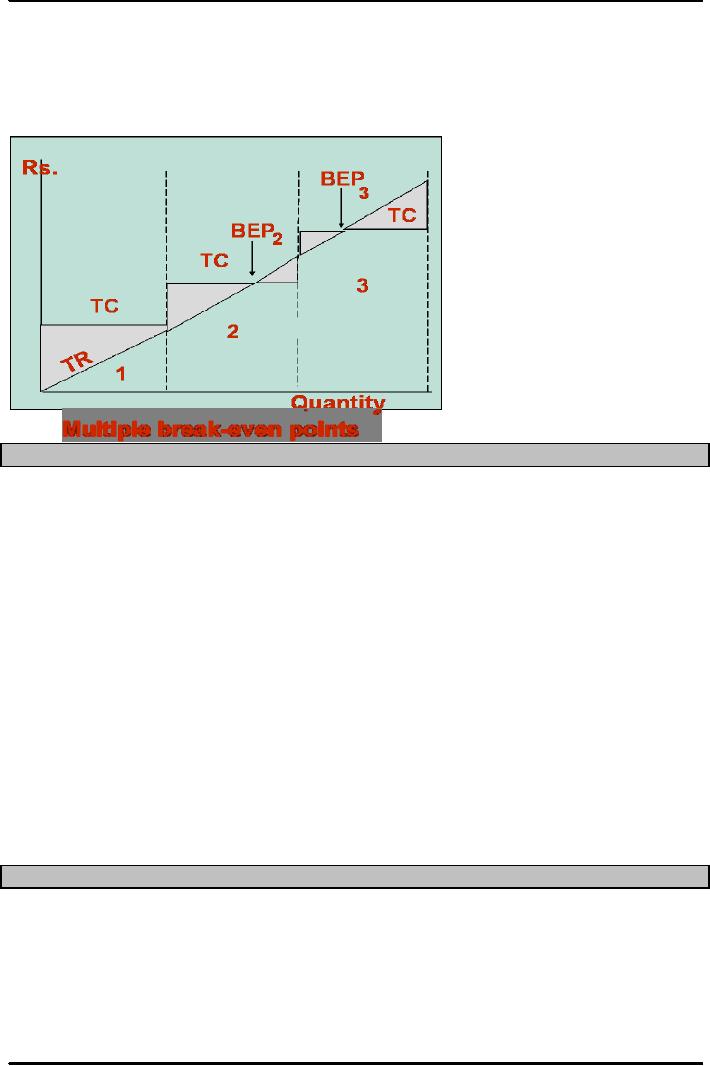
alternatives involve step
costs.
These
step costs increase in
stepwise as potential volume
increases.
For
example an organization may have the
option of purchasing one, two or three
machines, with
each
additional machine increasing fixed cost
in a non linear way.
In
such a scenario, the fixed
costs and potential volume
would depend on number of machines
purchased
or installed.
Break-Even
Problem with Step Fixed
Costs
75
Production
and Operations Management
MGT613
VU
The
implication is that multiple
break even quantities may
occur, possibly one for each
range.
Note
the total revenue line might
not intersect the fixed cost
line in a particular range, meaning
that
would
be no break even point in the first
range.
In
order to decide how many
machines to purchase a manager
must consider projected
annual
demand
(volume) relative to Multiple
Break Even Points and the most
appropriate number of
machines.
Example
The
Business Owner of a sports
good factory in Sialkot is
contemplating adding a new
line of cricket
bats,
which will require leasing
new equipment for a monthly
payment of Rs. 60,000.
Variable Costs
would
be Rs. 200 per bat and Bats
would be sold for Rs.
2000 only.
1.
How many bats would be
sold in order to break
even?
2.
What would be the profit or
loss if the 100 bats are
made and sold in 1 month?
3.
How many bats must be
sold to realize a profit of
Rs. 40,000?
Solution
1.
QBEP= FC/ ( R-VC)
=Rs.
60,000/ 2000-200=
60,000/1800
=
33.33 bats = 33 Bats
2.
For Q =100 bats, the Profit
or Loss would be
P=
Q(R-VC)-FC=100(2000-200)-60,000=100X
1800-60,000=180,000-60,000=120,000
3.
For P =40,000
Q
= (FC+P)/ (
R-VC)=(60,000+40,000)/(2000-200)
=100,000/1800=55.56
= 56 Bats
Financial
Analysis
Mathematical
Techniques that can be used
to evaluate alternatives
are
�Cost
Volume Relationships
�Financial
Analysis
�Decision
Theory
�Waiting
Line Analysis
76

Production
and Operations Management
MGT613
VU
Capacity
alternatives are often
evaluated with the aid of
certain financial analyses. Operations
manager
along
with managerial accountant often
work to calculate what cash
flow or present value in
terms of
rupees
is available for the organization to
proceed with a capacity
alternative decision. It is important
to
understand
what cash flow and
present values are
1.
Cash Flow - the difference between
cash received from sales
and other sources, and
cash
outflow
for labor, material, overhead,
and taxes.
2.
Present Value - the sum, in
current value, of all future
cash flows of an investment
proposal.
Waiting
Line Analysis and decision
theory are also two
important ways in which capacity
alternatives
are
evaluated.
Conclusion
Capacity
planning is important that it helps an
organization to formulate its
long term (organizational)
strategy
and short term (operational) strategy.
Long term capacity decisions relate to
overall level of
capacity
while short term capacity decisions refer
to seasonal, random or irregular
variations in demand.
Ideally
capacity should match demand
but it rarely happens.
Capacity alternative decisions should
be
taken
in view of what we have already covered
the concept of systems approach or the
over all big
picture
approach as quite often removing a
bottle neck at the department level may
not improve the
organizations
effectiveness. An effective operations manager
would make use of qualitative as
well as
quantitative
analysis to evaluate capacity
alternatives.
Capacity
decisions are often based on
facilities layout and
together they define the
very existence of an
organizational
unit.
77
Table of Contents:
- INTRODUCTION TO PRODUCTION AND OPERATIONS MANAGEMENT
- INTRODUCTION TO PRODUCTION AND OPERATIONS MANAGEMENT:Decision Making
- INTRODUCTION TO PRODUCTION AND OPERATIONS MANAGEMENT:Strategy
- INTRODUCTION TO PRODUCTION AND OPERATIONS MANAGEMENT:Service Delivery System
- INTRODUCTION TO PRODUCTION AND OPERATIONS MANAGEMENT:Productivity
- INTRODUCTION TO PRODUCTION AND OPERATIONS MANAGEMENT:The Decision Process
- INTRODUCTION TO PRODUCTION AND OPERATIONS MANAGEMENT:Demand Management
- Roadmap to the Lecture:Fundamental Types of Forecasts, Finer Classification of Forecasts
- Time Series Forecasts:Techniques for Averaging, Simple Moving Average Solution
- The formula for the moving average is:Exponential Smoothing Model, Common Nonlinear Trends
- The formula for the moving average is:Major factors in design strategy
- The formula for the moving average is:Standardization, Mass Customization
- The formula for the moving average is:DESIGN STRATEGIES
- The formula for the moving average is:Measuring Reliability, AVAILABILITY
- The formula for the moving average is:Learning Objectives, Capacity Planning
- The formula for the moving average is:Efficiency and Utilization, Evaluating Alternatives
- The formula for the moving average is:Evaluating Alternatives, Financial Analysis
- PROCESS SELECTION:Types of Operation, Intermittent Processing
- PROCESS SELECTION:Basic Layout Types, Advantages of Product Layout
- PROCESS SELECTION:Cellular Layouts, Facilities Layouts, Importance of Layout Decisions
- DESIGN OF WORK SYSTEMS:Job Design, Specialization, Methods Analysis
- LOCATION PLANNING AND ANALYSIS:MANAGING GLOBAL OPERATIONS, Regional Factors
- MANAGEMENT OF QUALITY:Dimensions of Quality, Examples of Service Quality
- SERVICE QUALITY:Moments of Truth, Perceived Service Quality, Service Gap Analysis
- TOTAL QUALITY MANAGEMENT:Determinants of Quality, Responsibility for Quality
- TQM QUALITY:Six Sigma Team, PROCESS IMPROVEMENT
- QUALITY CONTROL & QUALITY ASSURANCE:INSPECTION, Control Chart
- ACCEPTANCE SAMPLING:CHOOSING A PLAN, CONSUMER’S AND PRODUCER’S RISK
- AGGREGATE PLANNING:Demand and Capacity Options
- AGGREGATE PLANNING:Aggregate Planning Relationships, Master Scheduling
- INVENTORY MANAGEMENT:Objective of Inventory Control, Inventory Counting Systems
- INVENTORY MANAGEMENT:ABC Classification System, Cycle Counting
- INVENTORY MANAGEMENT:Economic Production Quantity Assumptions
- INVENTORY MANAGEMENT:Independent and Dependent Demand
- INVENTORY MANAGEMENT:Capacity Planning, Manufacturing Resource Planning
- JUST IN TIME PRODUCTION SYSTEMS:Organizational and Operational Strategies
- JUST IN TIME PRODUCTION SYSTEMS:Operational Benefits, Kanban Formula
- JUST IN TIME PRODUCTION SYSTEMS:Secondary Goals, Tiered Supplier Network
- SUPPLY CHAIN MANAGEMENT:Logistics, Distribution Requirements Planning
- SUPPLY CHAIN MANAGEMENT:Supply Chain Benefits and Drawbacks
- SCHEDULING:High-Volume Systems, Load Chart, Hungarian Method
- SEQUENCING:Assumptions to Priority Rules, Scheduling Service Operations
- PROJECT MANAGEMENT:Project Life Cycle, Work Breakdown Structure
- PROJECT MANAGEMENT:Computing Algorithm, Project Crashing, Risk Management
- Waiting Lines:Queuing Analysis, System Characteristics, Priority Model