 |

Production
and Operations Management
MGT613
VU
Lesson
16
It is
important to realize that
managers make capacity decisions at the
organizational level and not
at
the
operational level. Often,
debottlenecking a process can
increase departmental efficiency
without
increasing
or improving the organizational performance.
This does not mean
that capacity decisions
are
not taken at the operational
level rather managers end up making
capacity decisions at the
individual
process level in accounting,
finance, human resources, information
technologies,
marketing
and operations departments.
Operations
Mangers must understand capacity
measures, economies and
diseconomies of scale,
capacity
cushions and trade off between
customer service and capacity
utilization.
Efficiency
and Utilization
Operations
Manager should know what is
Capacity? They should be
able to identify the terms
Design
Capacity
and Effective capacity
before they can understand another
important concept of
Utilization.
Design
capacity is the maximum output rate or
service capacity an operation, process,
or
facility.
Organizations
facility or operation is designed for
Effective capacity which refers to
Design
capacity
minus allowances such as personal time, maintenance,
and scrap
Actual
output is the rate of output actually
achieved--cannot exceed effective
capacity.
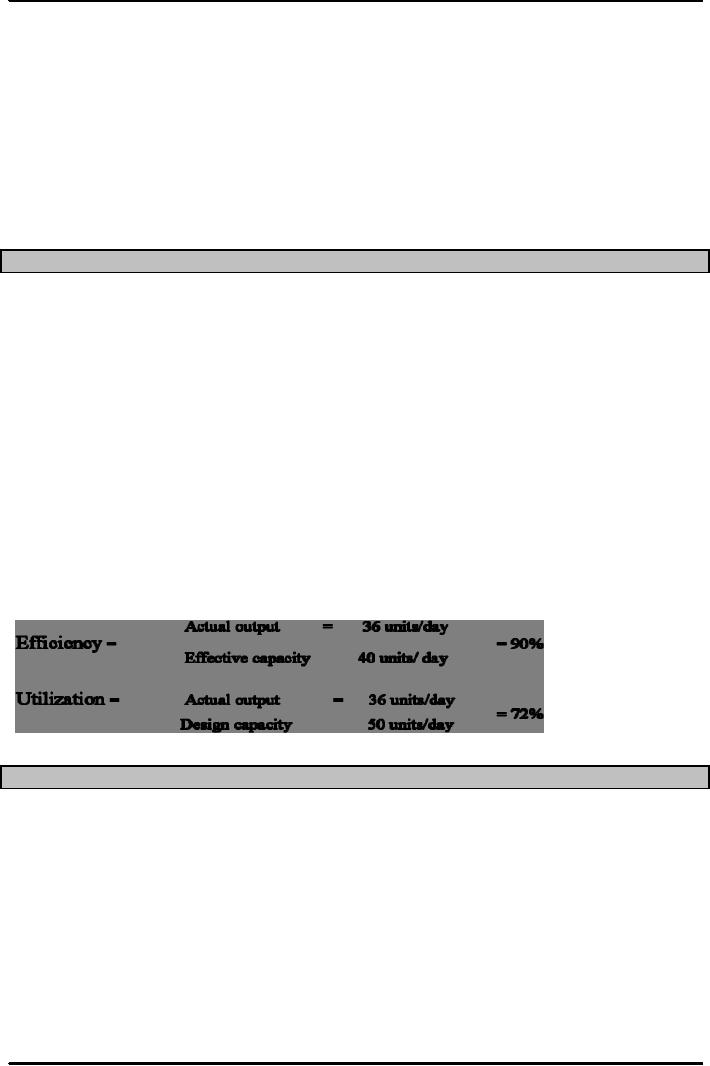
Efficiency/Utilization
Example
Use
the following data to determine the
Efficiency and
Utilization
Design
capacity = 50 trucks/day
Effective
capacity = 40 trucks/day
Actual
output = 36 units/day
Determinants
of Effective Capacity
Operations
Manager often focus on determinants of
effective capacity by taking
into account both
macro
and micro levels. At the macro
levels the managers look for
Supply chain and External
factors,
while
at the micro level they look
for operational factors including
facilities and man and machine
resources.
There are 7 determinants of effective
capacity namely:-
1.
Facilities. The design of facilities
includes the size as well as the
provision of expansion.
Other
important
factors that are necessary
include transportation costs,
distance to market,
labor
supply,
energy supply sources and the
ease and smoothness with
which work can be
performed.
We
should also include
environmental factors such as heating,
lighting and ventilation
which
not
only increase the performance of the
workforce but also act as
source of motivation
and
worker
loyalty. A failure to comply
with this would indicate
poor design which in
reality
translates
to lack of managerial
acumen.
68

Production
and Operations Management
MGT613
VU
2.
Product and service factors can have a tremendous
influence on capacity. E.g.
when items are
similar,
the ability of the system to produce
those items is generally much greater
than when
successive
items are different and unique.
The idea is more uniformity in the
final product
service
output the greater capacity. I am making
a reference to a PC manufacturer in USA
which
decided that it would standardize its
products and split its
assembly lines only at the
point
where
the a small differential product
feature was required.
3.
Process factors refer to the quantity and
quality requirements of a process.
Quantity always
refers
to capacity. Another added
feature is quality of output. If
quality of output does not
match
the
standard requirements it would generate
inspection and possible reworks.
4.
Human factors include skill,
craftsmanship, training and qualification to
handle any job it
also
includes
the motivational factors.
5.
Operational factors with respect to
effective capacity always
refer to scheduling, late
deliveries,
acceptability
of purchased materials, parts, quality
inspection, control procedures and
inventory
problems.
Scheduling issues arise when
an organization has a difference in
equipment
capabilities
for development of alternative
capacities. Inventory problems have a
negative
impact
on capacity
6.
Supply chain factors relate to
any short coming to suppliers, warehouse
processing, operational
hick
up or distribution issues.
7.
External factors include product
standards, safety regulations, unions and
pollution control
standards.
At times organizations have experienced shutting
down of their facility if
they could
not
provide support to government regulations
of pollution control.
Strategy
Formulation With respect to
Capacity Planning
1.
Capacity strategy for long-term
demand which focus on demand
patterns and takes into
account
growth
rate and variability
2.
Facilities that focus on cost of
building and operating
3.
Technological changes relate to rate and
direction of technology
changes
4.
Behavior of competitors
5.
Availability of capital and
other inputs
Key
Decisions of Capacity Planning
It
is important to identify the key
decisions in order to carryout a correct
capacity planning
decision.
Some
of the common key decisions are
1.
Amount of capacity
needed
2.
Timing of changes
3.
Need to maintain
balance
4.
Extent of flexibility of
facilities
Steps
for Capacity Planning
Strategy
It
is important to understand how to
formulate a capacity planning
strategy
1.
Estimate future capacity
requirements
2.
Evaluate existing
capacity
3.
Identify alternatives
4.
Conduct financial analysis
5.
Assess key qualitative
issues
6.
Select one
alternative
7.
Implement alternative
chosen
8.
Monitor results
Developing
Capacity Alternatives
69

Production
and Operations Management
MGT613
VU
1.
Design flexibility into
systems refers to long term nature of
expansion, if at the time of
original
design,
flexibility alternative is provided, and
it would save cost in
remodeling and
modifications
when expansion is carried
out later.
2.
Take stage of life cycle
into account. It is important that
operations manager observe and
check
whether
the capacity increase alternative is
for a new product/service or mature
product or
service.
The predictability for a new
service is riskier as compared to an established
mature
product
or service.
3.
Take a "big picture" approach to
capacity changes while
developing the capacity of the
system,
it
is necessary to understand the interrelationship of
the components of the system. The
big
picture
approach relates to setting up of parking
space, house keeping and landscaping if
an
expansion
is to be accommodated in a multi purpose
shopping plus apartment
complex.
4.
By developing capacity alternatives,
organizations prepare to deal with
capacity "chunks"
Capacity
increases are normally
obtained in big chunks instead of
incremental increase. A
steel
mills
furnace may not be able to
provide exact required increase in
capacity and thus
would
provide
excessive capacity which may
lead to increase in inventory.
E.g. the demand for
steel
say
is 2000 tone per annum in the city of
sukkhur, from a local steel
mill the capacity is
1800
tones
per annum. The steel mill
can increase its production
from 1800 tones to 2200
tones per
annum
and not to exactly 2000
tones per annum.
Organizations
attempt to smooth out capacity
requirements. This topic is discussed in
more detail when
we
will cover the topic of
aggregate planning for the
time being we can see
that simply adding
capacity
by
increasing the size of workforce,
machines, facility does not
help. Operations manager should be
able
to
identify the optimal operating
level. All Production units have an
ideal or optimal level of
operation
in
terms of unit cost of
output. At the ideal level,
cost per unit is the lowest
for that production
unit.
Economies
of Scale and Diseconomies of
scale
An
operations manager should know
what economies and diseconomies of
scale are
Economies
of scale reflects a concept that
states the average unit cost
of a good or service can be
reduced
by increasing its output rate while
diseconomies of scale reflects the case
when the average cost
per
unit increases as the facility's
size increases.
If
the output rate is less than the
optimal level, increasing output rate
results in decreasing average
unit
costs
then it reflects Economies of Scale. On the
other hand if the output rate is more
than the optimal
level,
increasing the output rate results in increasing
average unit costs
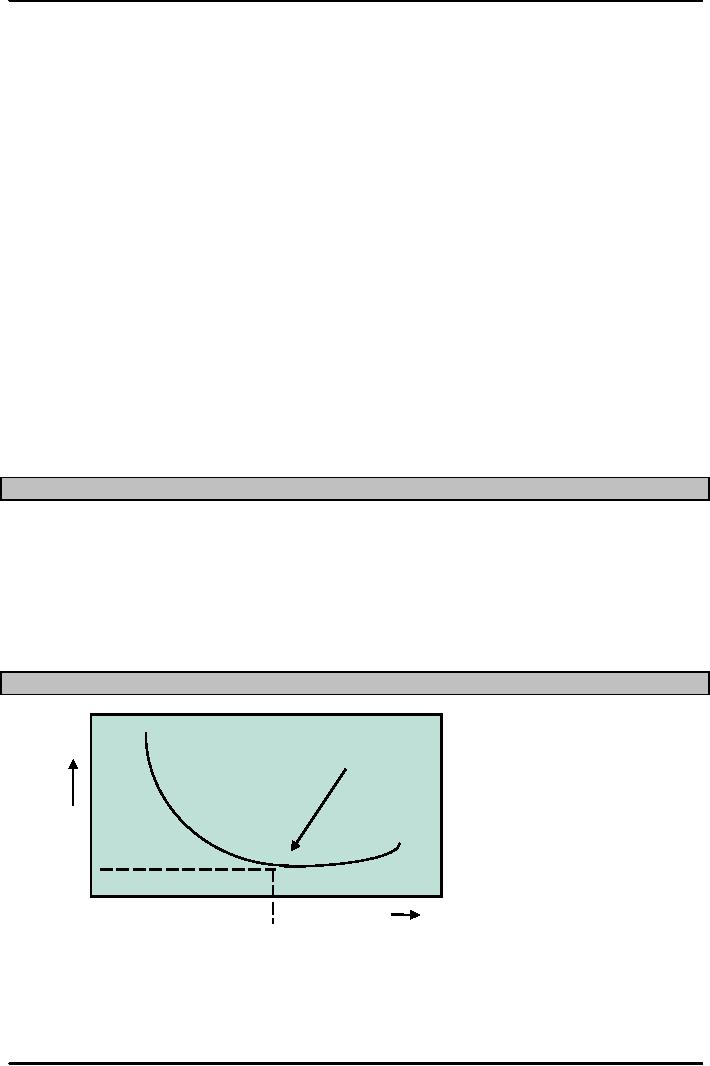
Evaluating
Alternatives
Minimum
Average Cost per Unit
Average
cost
per
unit
Minimum
Cost
0
Rate
of output
Explanation
of the Cost Curve
The
explanation for the shape of
the cost curve is that
low levels of output
(Production), the costs of
facilities
and equipment must be absorbed
(paid for) by few units.
Hence the cost per unit is very
high.
As
the output is increased, there are more
units to absorb the fixed
cost of utilities, facilities
and
equipment,
so unit cost is
decreased.
70

Production
and Operations Management
MGT613
VU
Minimum
Cost would be recorded at the
optimal rate, beyond that the
unit cost will
start
to increase. Other factors now
become more important which
include worker fatigue,
equipment
breakdown,
the loss of flexibility, which
leaves less margin for
error and increases
difficulty in
coordinating
activities.
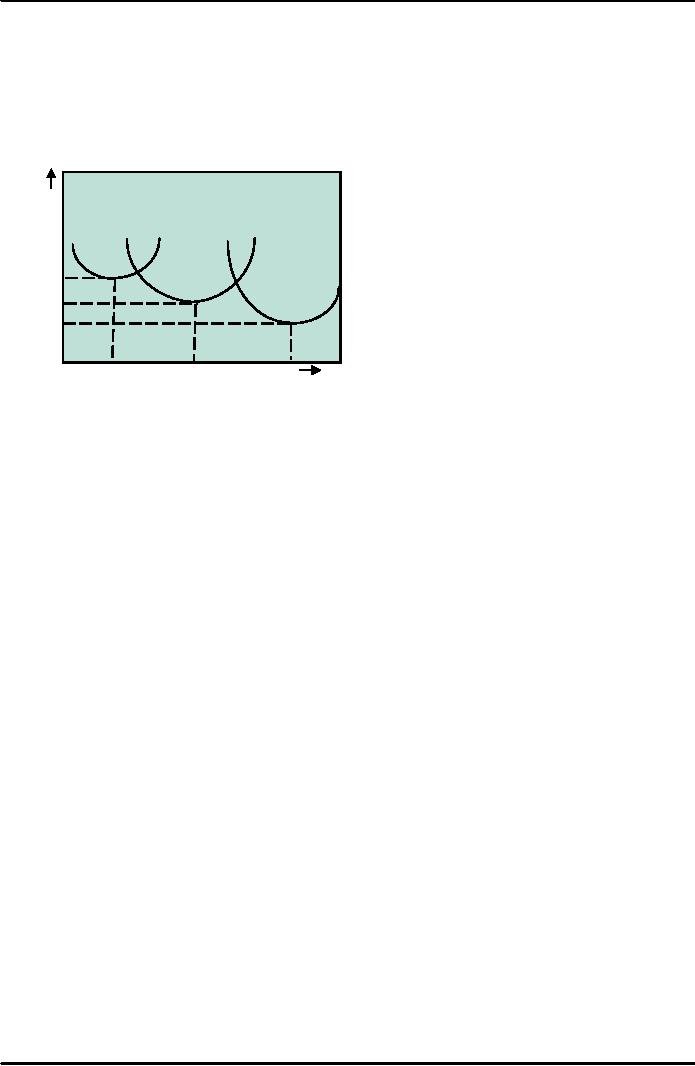
Evaluating
Alternatives
Minimum
cost & optimal operating rate are
functions of size of
production
unit.
Average
cost per unit
Small
Medium
plant
plant
Large
plant
0
Output
rate
Evaluating
Alternatives
As
the general capacity of the plant
increases, the optimal
output rate increases and
the
minimum
cost for the optimal rate
decreases.
This
is the prime reason why
larger plants tend to have higher
optimal output rates and
lower
minimum
costs than smaller plants.
The
senior management normally takes in to
account the same considerations in
addition to
availability
of financial, capital resources
and forecasted
demand.
The
important step is to determine
enough points for each
size facility to be able to
make a
comparison
among different sizes.
In
some industries or types of services,
facility sizes are given,
where as in other facility size
are
continuous
variable.
Occasionally
the management decides for a
size which does not have the
desired rate of output.
E.g.
Pharmaceutical Company, oil field,
gas fields.
An
organization needs to examine the
alternatives for future
capacity from a number of
different
perspectives.
Economic
Conditions set the external
conditions which influence the
following
1.
Will Alternative be feasible?
2.
How much will it
cost?
3.
How soon can we have
it?
4.
What will be the operating and
maintenance costs?
Possible
Negative Opinion due to the following
decisions.
1.
Decision to build a new
power plant, nuclear, coal,
geothermal
2.
Displacement of people if a new hydro
plant is to be built.
3.
Environmental issues related to
company's new
project.
71
Table of Contents:
- INTRODUCTION TO PRODUCTION AND OPERATIONS MANAGEMENT
- INTRODUCTION TO PRODUCTION AND OPERATIONS MANAGEMENT:Decision Making
- INTRODUCTION TO PRODUCTION AND OPERATIONS MANAGEMENT:Strategy
- INTRODUCTION TO PRODUCTION AND OPERATIONS MANAGEMENT:Service Delivery System
- INTRODUCTION TO PRODUCTION AND OPERATIONS MANAGEMENT:Productivity
- INTRODUCTION TO PRODUCTION AND OPERATIONS MANAGEMENT:The Decision Process
- INTRODUCTION TO PRODUCTION AND OPERATIONS MANAGEMENT:Demand Management
- Roadmap to the Lecture:Fundamental Types of Forecasts, Finer Classification of Forecasts
- Time Series Forecasts:Techniques for Averaging, Simple Moving Average Solution
- The formula for the moving average is:Exponential Smoothing Model, Common Nonlinear Trends
- The formula for the moving average is:Major factors in design strategy
- The formula for the moving average is:Standardization, Mass Customization
- The formula for the moving average is:DESIGN STRATEGIES
- The formula for the moving average is:Measuring Reliability, AVAILABILITY
- The formula for the moving average is:Learning Objectives, Capacity Planning
- The formula for the moving average is:Efficiency and Utilization, Evaluating Alternatives
- The formula for the moving average is:Evaluating Alternatives, Financial Analysis
- PROCESS SELECTION:Types of Operation, Intermittent Processing
- PROCESS SELECTION:Basic Layout Types, Advantages of Product Layout
- PROCESS SELECTION:Cellular Layouts, Facilities Layouts, Importance of Layout Decisions
- DESIGN OF WORK SYSTEMS:Job Design, Specialization, Methods Analysis
- LOCATION PLANNING AND ANALYSIS:MANAGING GLOBAL OPERATIONS, Regional Factors
- MANAGEMENT OF QUALITY:Dimensions of Quality, Examples of Service Quality
- SERVICE QUALITY:Moments of Truth, Perceived Service Quality, Service Gap Analysis
- TOTAL QUALITY MANAGEMENT:Determinants of Quality, Responsibility for Quality
- TQM QUALITY:Six Sigma Team, PROCESS IMPROVEMENT
- QUALITY CONTROL & QUALITY ASSURANCE:INSPECTION, Control Chart
- ACCEPTANCE SAMPLING:CHOOSING A PLAN, CONSUMER’S AND PRODUCER’S RISK
- AGGREGATE PLANNING:Demand and Capacity Options
- AGGREGATE PLANNING:Aggregate Planning Relationships, Master Scheduling
- INVENTORY MANAGEMENT:Objective of Inventory Control, Inventory Counting Systems
- INVENTORY MANAGEMENT:ABC Classification System, Cycle Counting
- INVENTORY MANAGEMENT:Economic Production Quantity Assumptions
- INVENTORY MANAGEMENT:Independent and Dependent Demand
- INVENTORY MANAGEMENT:Capacity Planning, Manufacturing Resource Planning
- JUST IN TIME PRODUCTION SYSTEMS:Organizational and Operational Strategies
- JUST IN TIME PRODUCTION SYSTEMS:Operational Benefits, Kanban Formula
- JUST IN TIME PRODUCTION SYSTEMS:Secondary Goals, Tiered Supplier Network
- SUPPLY CHAIN MANAGEMENT:Logistics, Distribution Requirements Planning
- SUPPLY CHAIN MANAGEMENT:Supply Chain Benefits and Drawbacks
- SCHEDULING:High-Volume Systems, Load Chart, Hungarian Method
- SEQUENCING:Assumptions to Priority Rules, Scheduling Service Operations
- PROJECT MANAGEMENT:Project Life Cycle, Work Breakdown Structure
- PROJECT MANAGEMENT:Computing Algorithm, Project Crashing, Risk Management
- Waiting Lines:Queuing Analysis, System Characteristics, Priority Model