 |
BOND PRICING & RISK:Valuing the Principal Payment, Risk |
| << APPLICATION OF PRESENT VALUE CONCEPTS:Compound Annual Rates |
| MEASURING RISK:Variance, Standard Deviation, Value at Risk, Risk Aversion >> |

Money
& Banking MGT411
VU
Lesson
10
BOND
PRICING & RISK
Bond
Pricing
Real
Vs Nominal Interest
Rates
Risk
Characteristics
Measurement
Bond
Pricing
A
bond is a promise to make a series of
payments on specific future
date.
It
is a legal contract issued as part of an
arrangement to borrow
The
most common type is a coupon
bond, which makes annual
payments called
coupon
payments
The
percentage rate is called the coupon
rate
The
bond also specifies a maturity
date (n) and has a final
payment (F), which is the
principal,
face
value, or par value of the
bond
The
price of a bond is the present
value of its payments
To
value a bond we need to
value the repayment of principal and the
payments of interest
Valuing
the Principal
Payment
A
straightforward application of present
value where n represents the maturity of
the bond
Valuing
the Coupon Payments:
Requires
calculating the present value of the
payments and then adding
them; remember,
present
value is additive
Valuing
the Coupon Payments plus
Principal
Means
combining the above
Payment
stops at the maturity date.
(n)
A
payment is for the face
value (F) or principle of the
bond
Coupon
Bonds make annual payments
called, Coupon Payments (C),
based upon an interest
rate,
the coupon rate (ic),
C=ic*F
A
bond that has a $100
principle payment in n years.
The present
Value
(PBP)
of this is now:
F
$
100
=
=
P
BP
(1
+
i
)
(1
+
i
)
n
n
If
the bond has n coupon
payments (C), where C=
ic *
F, the Present Value (PCP)
of the coupon
payments
is:
C
C
C
C
P
CP =
+
+
+
......
+
(1
+
i
)
1
(1
+
i
)
2
(1
+
i
)
3
(1
+
i
)
n
29

Money
& Banking MGT411
VU
Present
Value of Coupon Bond
(PCB)
= Present value of Yearly
Coupon Payments (PCP) +
Present Value
of
the Principal Payment (PBP)
C ⎤
⎡ C
C
C
F
+
PCB =
PCP +
PBP = ⎢
+
+
+
......
+
⎥
(1
+
i)
n
⎦ (1
+
i)
n
⎣
(1
+
i)
(1 +
i)
(1
+
i)
3
1
2
Note:
The
value of the coupon bond
rises when the yearly coupon
payments rise and when the
interest
rate
falls
Lower
interest rates mean higher
bond prices and vice
versa.
The
value of a bond varies inversely
with the interest rate used to discount
the promised
payments
Real
and Nominal Interest
Rates
So
far we have been computing the
present value using nominal
interest rates (i), or interest
rates
expressed in current-dollar
terms
But
inflation affects the purchasing power of a
dollar, so we need to consider the real
interest
rate
(r), which is the inflation-adjusted
interest rate.
The
Fisher equation tells us that the
nominal interest rate is equal to the
real interest rate plus
the
expected rate of inflation
Fisher
Equation:
i=r+
e
Or
r
= i - �e
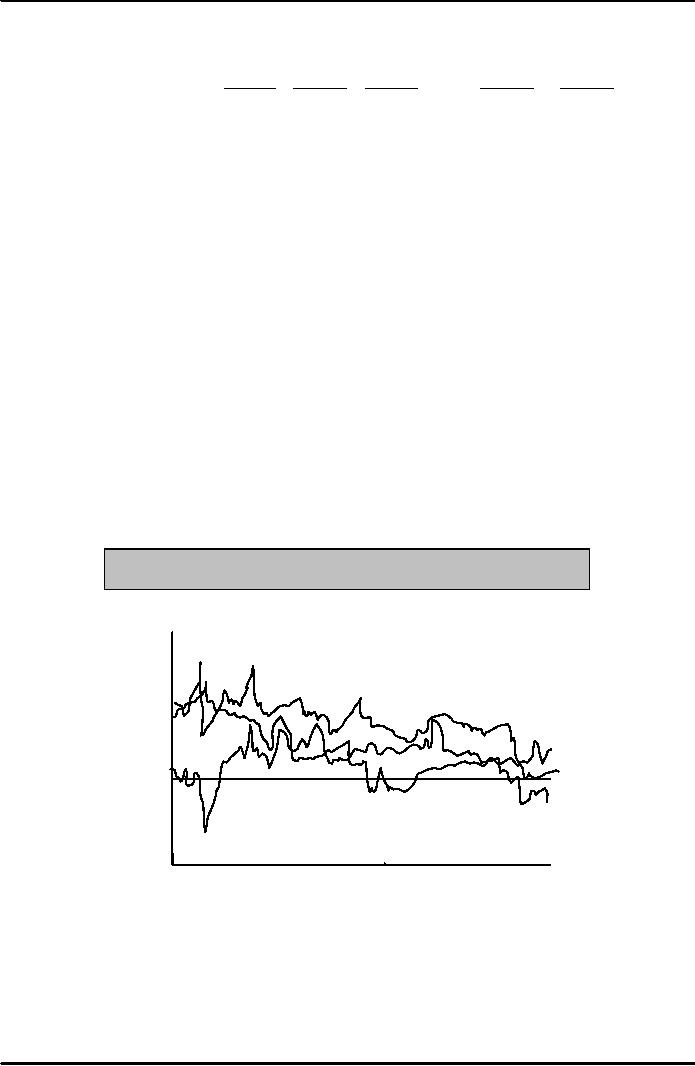
Figure:
Nominal Interest rates, Inflation,
and real interest
rates
20
15
10
5
0
-5
-10
1982
1985
1988
1991
1994
1997 2000
1979
2003
30

Money
& Banking MGT411
VU
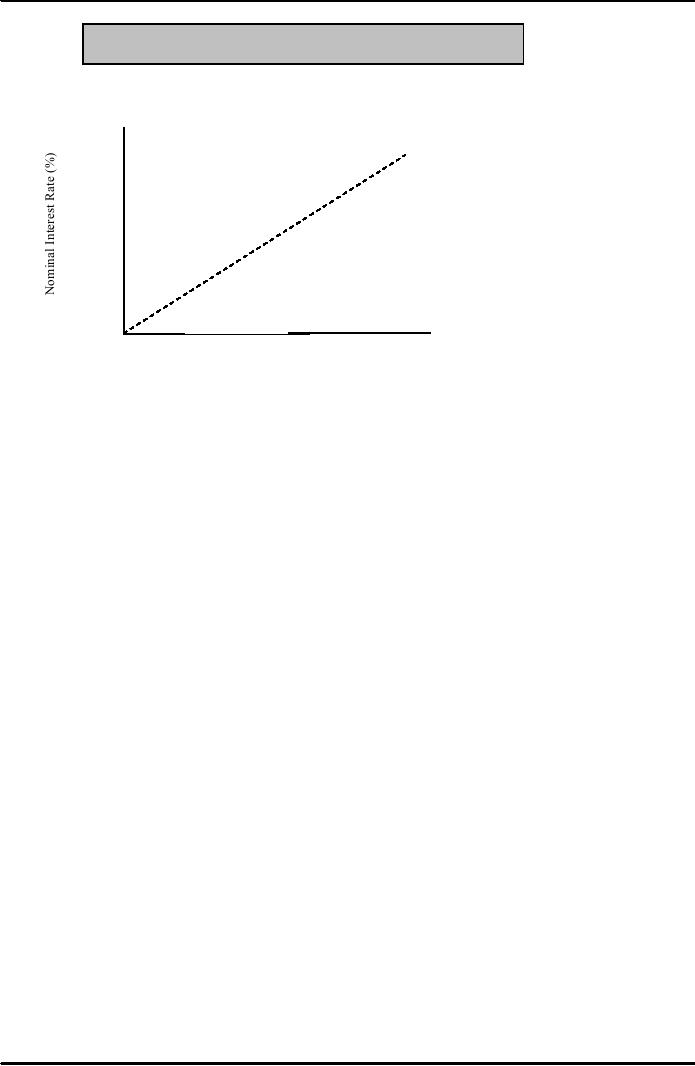
Figure:
Inflation and Nominal Interest
Rates, April 2004
30
Turkey
45�
line
�
25
20
Brazil
Russia
�
�
15
10
South
Africa
5
US
UK
15
25
20
5
10
30
0
Inflation
(%)
Risk
Every
day we make decisions that involve
financial and economic risk.
How
much car insurance should we
buy?
Should
we refinance the home loan
now or a year from
now?
Should
we save more for retirement, or
spend the extra money on a
new car?
Interestingly
enough, the tools we use
today to measure and analyze risk were
first developed to
help
players analyze games of
chance.
For
thousands of years, people have
played games based on a
throw of the dice, but they
had
little
understanding of how those
games actually worked
Since
the invention of probability theory, we
have come to realize that
many everyday events,
including
those in economics, finance, and even
weather forecasting, are best
thought of as
analogous
to the flip of a coin or the throw of a
die
Still,
while experts can make
educated guesses about the
future path of interest rates,
inflation,
or
the stock market, their predictions
are really only
that--guess.
And
while meteorologists are fairly
good at forecasting the weather a day or
two ahead,
economists,
financial advisors, and business gurus have
dismal records.
So
understanding the possibility of various
occurrences should allow
everyone to make
better
choices.
While risk cannot be eliminated, it
can often be managed
effectively.
Finally,
while most people view
risk as a curse to be avoided
whenever possible, risk
also
creates
opportunities.
The
payoff from a winning bet on one hand of
cards can often erase the
losses on a losing hand.
Thus
the importance of probability theory to
the development of modern financial
markets is
hard
to overemphasize.
People
require compensation for taking risks.
Without the capacity to measure
risk, we could
not
calculate a fair price for
transferring risk from one
person to another, nor could
we price
stocks
and bonds, much less sell
insurance.
The
market for options didn't
exist until economists learned
how to compute the price of an
option
using probability
theory
We
need a definition of risk
that focuses on the fact
that the outcomes of
financial and
economic
decisions are almost always unknown at
the time the decisions are
made.
Risk
is a measure of uncertainty about the
future payoff of an investment,
measured over some
time
horizon and relative to a
benchmark.
31

Money
& Banking MGT411
VU
Characteristics
of risk
Risk
can be quantified.
Risk
arises from uncertainty
about the future.
Risk
has to do with the future
payoff to an investment, which is
unknown.
Our
definition of risk refers to an
investment or group of
investments.
Risk
must be measured over some
time horizon.
Risk
must be measured relative to
some benchmark, not in
isolation.
If
you want to know the risk
associated with a specific
investment strategy, the most
appropriate
benchmark
would be the risk associated
with other investing
strategies
Measuring
Risk
Measuring
Risk requires:
List
of all possible outcomes
Chance
of each one occurring
The
tossing of a coin
What
are possible outcomes?
What
is the chance of each one
occurring?
Is
coin fair?
Probability
is a measure of likelihood that an even
will occur
Its
value is between zero and
one
The
closer probability is to zero,
less likely it is that an
event will occur.
No
chance of occurring if probability is
exactly zero
The
closer probability is to one, more likely
it is that an event will
occur.
The
event will definitely occur
if probability is exactly one
Probabilities
can also be expressed as
frequencies
Table:
A Simple Example: All
Possible Outcomes of a Single
Coin Toss
Possibilities
Probability
Outcome
#1
1/2
Heads
#2
1/2
Tails
We
must include all possible
outcomes when constructing
such a table
The
sum of the probabilities of all the
possible outcomes must be 1, since
one of the possible
outcomes
must occur (we just don't
know which one)
To
calculate the expected value of an investment,
multiply each possible payoff by
its
probability
and then sum all the
results. This is also known
as the mean.
Case
1
An
Investment can rise or fall in
value. Assume that an asset
purchased for $1000 is
equally likely to
fall
to $700 or rise to $1400
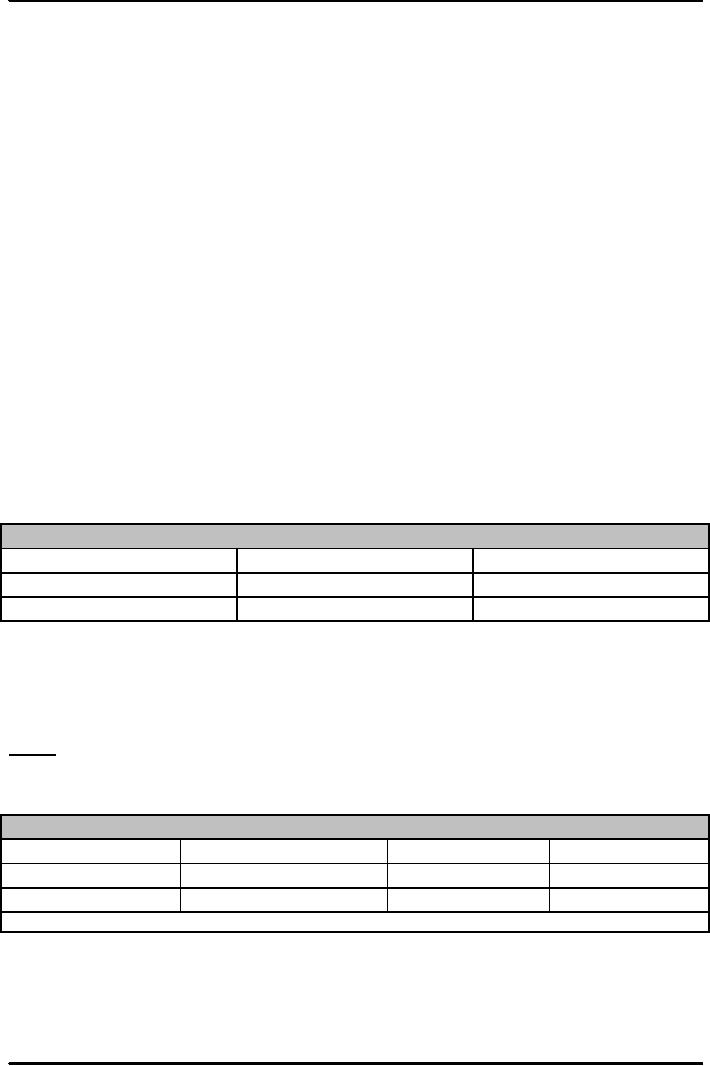
Table:
Investing $1,000: Case
1
Possibilities
Probability
Payoff
Payoff
�Probability
#1
1/2
$700
$350
#2
1/2
$1,400
$700
Expected
Value = Sum of (Probability
times Payoff) =
$1,050
32

Money
& Banking MGT411
VU
Expected
Value = � ($700) + � ($1400) =
$1050
Case
2
The
$1,000 investment might pay
off
$100
(prob=.1) or
$2000
(prob=.1) or
$700
(prob=.4) or
$1400
(prob=.4)
Table:
Investing $1,000: Case
2
Possibilities
Probability
Payoff
Payoff
�Probability
#1
0.1
$100
$10
#2
0.4
$700
$280
#3
0.4
$1,400
$560
$200
#4
0.1
$2,000
Expected
Value = Sum of (Probability
times Payoff) =
$1,050
Investment
payoffs are usually
discussed in percentage returns instead of in
dollar amounts; this
allows
investors to compute the gain or loss on the
investment regardless of its
size
Though
both cases have the same expected
return, $50 on a $1000
investment, or 5%, the
two
investments
have different levels or
risk.
A
wider payoff range indicates more
risk.
33
Table of Contents:
- TEXT AND REFERENCE MATERIAL & FIVE PARTS OF THE FINANCIAL SYSTEM
- FIVE CORE PRINCIPLES OF MONEY AND BANKING:Time has Value
- MONEY & THE PAYMENT SYSTEM:Distinctions among Money, Wealth, and Income
- OTHER FORMS OF PAYMENTS:Electronic Funds Transfer, E-money
- FINANCIAL INTERMEDIARIES:Indirect Finance, Financial and Economic Development
- FINANCIAL INSTRUMENTS & FINANCIAL MARKETS:Primarily Stores of Value
- FINANCIAL INSTITUTIONS:The structure of the financial industry
- TIME VALUE OF MONEY:Future Value, Present Value
- APPLICATION OF PRESENT VALUE CONCEPTS:Compound Annual Rates
- BOND PRICING & RISK:Valuing the Principal Payment, Risk
- MEASURING RISK:Variance, Standard Deviation, Value at Risk, Risk Aversion
- EVALUATING RISK:Deciding if a risk is worth taking, Sources of Risk
- BONDS & BONDS PRICING:Zero-Coupon Bonds, Fixed Payment Loans
- YIELD TO MATURIRY:Current Yield, Holding Period Returns
- SHIFTS IN EQUILIBRIUM IN THE BOND MARKET & RISK
- BONDS & SOURCES OF BOND RISK:Inflation Risk, Bond Ratings
- TAX EFFECT & TERM STRUCTURE OF INTEREST RATE:Expectations Hypothesis
- THE LIQUIDITY PREMIUM THEORY:Essential Characteristics of Common Stock
- VALUING STOCKS:Fundamental Value and the Dividend-Discount Model
- RISK AND VALUE OF STOCKS:The Theory of Efficient Markets
- ROLE OF FINANCIAL INTERMEDIARIES:Pooling Savings
- ROLE OF FINANCIAL INTERMEDIARIES (CONTINUED):Providing Liquidity
- BANKING:The Balance Sheet of Commercial Banks, Assets: Uses of Funds
- BALANCE SHEET OF COMMERCIAL BANKS:Bank Capital and Profitability
- BANK RISK:Liquidity Risk, Credit Risk, Interest-Rate Risk
- INTEREST RATE RISK:Trading Risk, Other Risks, The Globalization of Banking
- NON- DEPOSITORY INSTITUTIONS:Insurance Companies, Securities Firms
- SECURITIES FIRMS (Continued):Finance Companies, Banking Crisis
- THE GOVERNMENT SAFETY NET:Supervision and Examination
- THE GOVERNMENT'S BANK:The Bankers' Bank, Low, Stable Inflation
- LOW, STABLE INFLATION:High, Stable Real Growth
- MEETING THE CHALLENGE: CREATING A SUCCESSFUL CENTRAL BANK
- THE MONETARY BASE:Changing the Size and Composition of the Balance Sheet
- DEPOSIT CREATION IN A SINGLE BANK:Types of Reserves
- MONEY MULTIPLIER:The Quantity of Money (M) Depends on
- TARGET FEDERAL FUNDS RATE AND OPEN MARKET OPERATION
- WHY DO WE CARE ABOUT MONETARY AGGREGATES?The Facts about Velocity
- THE FACTS ABOUT VELOCITY:Money Growth + Velocity Growth = Inflation + Real Growth
- THE PORTFOLIO DEMAND FOR MONEY:Output and Inflation in the Long Run
- MONEY GROWTH, INFLATION, AND AGGREGATE DEMAND
- DERIVING THE MONETARY POLICY REACTION CURVE
- THE AGGREGATE DEMAND CURVE:Shifting the Aggregate Demand Curve
- THE AGGREGATE SUPPLY CURVE:Inflation Shocks
- EQUILIBRIUM AND THE DETERMINATION OF OUTPUT AND INFLATION
- SHIFTS IN POTENTIAL OUTPUT AND REAL BUSINESS CYCLE THEORY