 |

Financial
Management MGT201
VU
Lesson
21
2-
STOCK PORTFOLIO THEORY, RISK
AND EXPECTED RETURN
Learning
Objectives:
After
going through this lecture,
you would be able to have an
understanding of the following
topics
�
2-Stock
Portfolio Theory
�
Risk
& Expected Return
In
this lecture, we will
continue our discussion on the
risk. One of the easiest way
of calculating risk
using
probability is by understanding the
chance that are embedded in
the game of cards and the
fundamentals
of probability are very
easily understood. We discuss in this
lecture calculation of
risk
using
probability. But first we
recap the previous concepts
formula and
Recap
of Risk Basics:
Risk:
It arises because of Uncertainty,
Volatility, and Spread in possible
out comes. There are
many
possible
outcomes (pi) for Expected
Rate of Returns
(r.i).
It
is measured using Standard Deviation or
Variance.
Risk
= Std Dev = σ
=
√
( r i - <
r i > )2 p i . = "Sigma"
Bell
Curve Assumption: In
this it is assumed that the
forecasted outcome of events will be
distributed
in
the shape of a Normal Probability
Distribution. The advantage we gain
from using this that
after
calculating
the standard deviation for
any particular investment we have an
idea that what the
distribution
or the spread of possible outcomes is
going to be like. If you use
normal distribution that
we
are
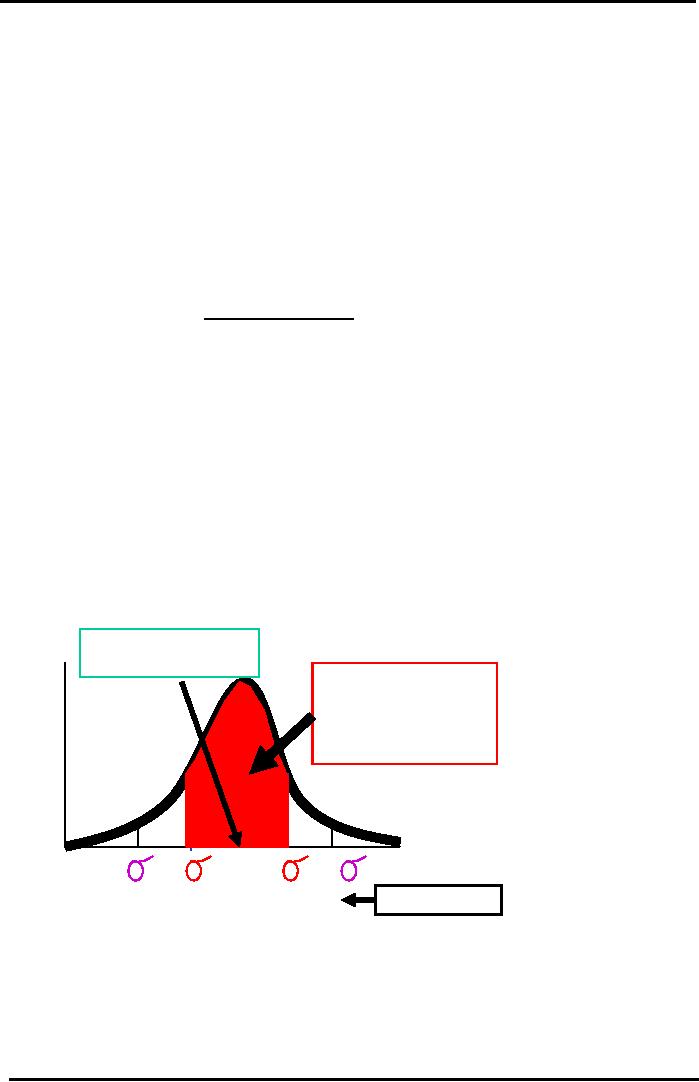
sure that 68.26% of the times the
Actual Future Rate of Return
will lie within -1σ
and
+1 σ
range
Coefficient
of Variation: Investment
Comparison Criterion used to
simultaneously account for
Risk &
Return
CV
= σ/ < r
>.
Our
Objective is to minimize Risk &
maximize Return.
<
r > = Exp or Weighted Avg
ROR =
pi
ri
Graphical
Standard Deviation
Expected
(or Mean)
Return
= <r> = 10%
+/-
1 Std Dev covers
Pr
68.26%
of the Area
ob
under
the Normal
ab
Curve
always
ilit
y
(p)
Return
( r ) %
-2
-1
+1
+2
-13.24%
+33.24%
Our
Example
Portfolio
Risk & Return:
Portfolio:
Portfolio
is defined as a Collection of Multiple
Investments. Most organization maintains
large
collection
or portfolio of investments and when we
talk about the risk and
return then we have to
consider
overall risk and return for
the entire portfolio. Portfolios
may have 2 or more stocks, bonds,
other
securities and investments or a mix of all. We
will focus on Stock
Portfolios.
90

Financial
Management MGT201
VU
Risk
is Relative:
The
RISK from investing in Stock
of Company ABC usually
decreases as you make
more
Investments
in other stocks of different
unrelated companies. This is a
logical fact because when
you
talk
about one business which is
earning you Rs 100,000 a
month then you not
look only on this
business
when you are running another
business that is losing you
Rs 200,000 a month,. You have to
look
at all the business and the
overall rate of return you
are generating, Similarly if
you are investing in
the
bonds or stocks then you
are need to look at the
overall risk and return of the
portfolio. The
important
thing to remember is that
risk of particular share of company
ABC will change if you
are
investing
in that share after you have
portfolio of many other
stocks. If you already have
large number
of
investments which you have made and
then if you invest in
particular share in company ABC
will be
different
Diversification:
The
important thing to remember is
that risk of particular
share of company ABC will
change if
you
are investing in that share
after you have portfolio of
many other stocks. If you
already have large
number
of investments and then you invest in
particular share in company ABC
then the risk will be
different.
Investing in many Different
Shares and Bonds and Projects of
Different Companies in
Different
Countries can reduce risk.
Diversified portfolios can
reduce risk. The level of
risk generally
reduces
as the size of the portfolio
increase.
Portfolio
Risk & Return:
What
matters is the Overall Risk &
Return on the entire Portfolio
(or Collection) of Investments.
The
Risk & Return of an Individual
Investment in a Stock or Bond
should be seen in terms of
its
Incremental
Effect on the Overall
Portfolio
Investment
Rule:
Investor
will try to Maximize
Portfolio Return and Minimize
Portfolio Risk. Investor
will NOT
take
on Additional Portfolio Risk
UNLESS compensated with
Additional Portfolio
Return.
Types
of Risks for a
Stock:
Types
of Stock-related Risks which cause
Uncertainty in future possible Returns
& Cash Flows:
Total
Stock Risk = Diversifiable Risk +
Market Risk
Diversifiable
Risk:
It
is known as Company-Specific or Unique or
Non-Systematic Risk. It is associated
with
random
events associated with Each
Company whose stocks you
are investing in i.e.
Winning major
contract,
losing a court case,
successful marketing campaign, losing a
charismatic CEO,...Diversifiable
Risk
can be Reduced using
Diversification. The bad random
events affecting one stock will
offset the
good
random events affecting another stock in
your portfolio
Market
Risk:
It
is known as Non-Diversifiable or Systematic
(Country-wide) or Beta Risk. It is
associated
with
Macroeconomic or Socio-Political or
Global events that
systematically affect Stock investments
in
every
Stock Market in the country
i.e. Inflation, Macro Market
Interest Rates, Recession,
and War.
Market
Risk can NOT be reduced by
Diversification
91

Financial
Management MGT201
VU
Portfolio
Size vs Risk
Graph
P
Po
Unique
or
Diversifiable
or
rtf
Specific
or Non-Systematic
Risk
oli
To
o
tal
Ri
Ri
M
Market
or Systematic or
Non-
sk
sk
Diversifiable
or Beta
Risk
=
Minimum
Possible Portfolio
Risk
n
7
20
40
Number
of Investments (Stocks) in the
Portfolio
Note:
About
100% of the Diversifiable
Risk (and 50% of the
Total
Risk) can be removed by Diversification
across 40 stocks.
Just
7 carefully chosen Un-Correlated
Stocks might be
enough
to
remove 30% of the Total
Risk.
Portfolio
Rate of Return
Portfolio's
Expected Rate of Return: ( rP
).
It
is the weighted average of the expected returns of
each individual investment in the
portfolio.
Formula
is similar to Expected Return for
Individual Investment but
interpretation is different:
Portfolio
Expected ROR
Formula:
rP
* =
r1
x1
+
r2
x2
+
r3
x3
+ ... +
rn
xn
.
Where
there are "n" different investments (i.e.
Stocks, Bonds, Projects,...) in your
portfolio. r1
represents
the expected return (in % pa) on
Investment No. 1 and
x1
represents
the weight of Investment
No.
1 (fraction of the Rupee value of the
total portfolio that
Investment No. 1
represents).
Example:
Suppose
that you hold a Portfolio of 2
Stock Investments:
Value
of Investment (Rs)
Exp
Individual Return (%)
Stock
A
30
20
Stock
B
70
10
Total
Value =
100
Expected
Portfolio Return
Calculation:
rP
* =
rA
xA
+
rB
xB
=
20% (30/100) + 10 %(
70/100)
=
6%
+
7%
=
13%
2
Stock" Investment Portfolio
Risk
Portfolio
Risk is generally not the
weighted average risk of the
Individual Investments. In fact, it
is
usually
less
Stock
(Investment) Portfolio Risk
Formula:
p
= √
XA2
σ
A 2
+XB2
σ
B 2
+ 2
(XA
XB
σ A
σ
B
AB)
Definition
of Terms:
XA
is Investment A's weight in
the total value of the
Portfolio. σ
A is Investment A's
AB
is the Correlation Coefficient that
measures the
Individual
Risk (or standard
deviation).
correlation
in the returns of the two investments. Last term is a
Covariance term
92

Financial
Management MGT201
VU
Example
Complete
2-Stock Investment Portfolio
Data:
Value
(Rs) Exp Return (%) Risk
(Std Dev)
Stock
A 30
20
20%
10
5%
Stock
B
70
Total
Value = 100
Correlation
Coeff Ro = + 0.6
2-Stock
Portfolio Risk
Calculation:
p
= √
XA2
σ
A
2 +XB2
σ
B
2 + 2 (XA
XB
σ
A
σ
B
AB)
=
{(30/100)2(20%)2
+
(70/100)2(5%)2
+2[(30/100)(70/100)(20%)(5%)(0.6)]}0.5
=
{(0.09)(0.04) + (0.49)(0.0025) + 2[
(0.0021) (0.6) ] } 0.5
=
{0.0036 + 0.001225 + 0.00252}
0.5.
=
{0.004825 + 0.00252} 0.5.
=
{0.007345} 0.5.
=
0.0857=8.57%
XA2
σA2
+ XB2
σB2
+ 2 (XA
XB
σA
σB
AB)
Risk
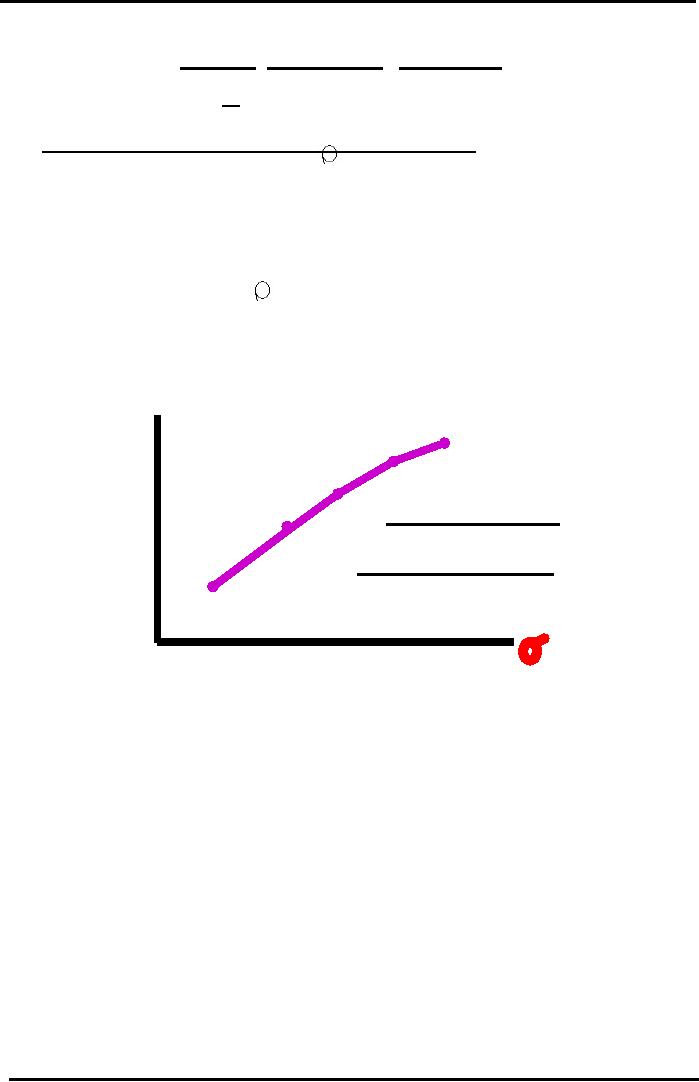
vs. Return Graph
Example
with 2-Stock Portfolio with
Positive Correlation
rP*
20%
Portfolio
17%
Return
15%
As
Risk INCREASES,
the
Investors' Required
13%
Return
INCREASES
10%
P
5%
9%
12%
15% 20%
Risk
93
Table of Contents:
- INTRODUCTION TO FINANCIAL MANAGEMENT:Corporate Financing & Capital Structure,
- OBJECTIVES OF FINANCIAL MANAGEMENT, FINANCIAL ASSETS AND FINANCIAL MARKETS:Real Assets, Bond
- ANALYSIS OF FINANCIAL STATEMENTS:Basic Financial Statements, Profit & Loss account or Income Statement
- TIME VALUE OF MONEY:Discounting & Net Present Value (NPV), Interest Theory
- FINANCIAL FORECASTING AND FINANCIAL PLANNING:Planning Documents, Drawback of Percent of Sales Method
- PRESENT VALUE AND DISCOUNTING:Interest Rates for Discounting Calculations
- DISCOUNTING CASH FLOW ANALYSIS, ANNUITIES AND PERPETUITIES:Multiple Compounding
- CAPITAL BUDGETING AND CAPITAL BUDGETING TECHNIQUES:Techniques of capital budgeting, Pay back period
- NET PRESENT VALUE (NPV) AND INTERNAL RATE OF RETURN (IRR):RANKING TWO DIFFERENT INVESTMENTS
- PROJECT CASH FLOWS, PROJECT TIMING, COMPARING PROJECTS, AND MODIFIED INTERNAL RATE OF RETURN (MIRR)
- SOME SPECIAL AREAS OF CAPITAL BUDGETING:SOME SPECIAL AREAS OF CAPITAL BUDGETING, SOME SPECIAL AREAS OF CAPITAL BUDGETING
- CAPITAL RATIONING AND INTERPRETATION OF IRR AND NPV WITH LIMITED CAPITAL.:Types of Problems in Capital Rationing
- BONDS AND CLASSIFICATION OF BONDS:Textile Weaving Factory Case Study, Characteristics of bonds, Convertible Bonds
- BONDS’ VALUATION:Long Bond - Risk Theory, Bond Portfolio Theory, Interest Rate Tradeoff
- BONDS VALUATION AND YIELD ON BONDS:Present Value formula for the bond
- INTRODUCTION TO STOCKS AND STOCK VALUATION:Share Concept, Finite Investment
- COMMON STOCK PRICING AND DIVIDEND GROWTH MODELS:Preferred Stock, Perpetual Investment
- COMMON STOCKS – RATE OF RETURN AND EPS PRICING MODEL:Earnings per Share (EPS) Pricing Model
- INTRODUCTION TO RISK, RISK AND RETURN FOR A SINGLE STOCK INVESTMENT:Diversifiable Risk, Diversification
- RISK FOR A SINGLE STOCK INVESTMENT, PROBABILITY GRAPHS AND COEFFICIENT OF VARIATION
- 2- STOCK PORTFOLIO THEORY, RISK AND EXPECTED RETURN:Diversification, Definition of Terms
- PORTFOLIO RISK ANALYSIS AND EFFICIENT PORTFOLIO MAPS
- EFFICIENT PORTFOLIOS, MARKET RISK AND CAPITAL MARKET LINE (CML):Market Risk & Portfolio Theory
- STOCK BETA, PORTFOLIO BETA AND INTRODUCTION TO SECURITY MARKET LINE:MARKET, Calculating Portfolio Beta
- STOCK BETAS &RISK, SML& RETURN AND STOCK PRICES IN EFFICIENT MARKS:Interpretation of Result
- SML GRAPH AND CAPITAL ASSET PRICING MODEL:NPV Calculations & Capital Budgeting
- RISK AND PORTFOLIO THEORY, CAPM, CRITICISM OF CAPM AND APPLICATION OF RISK THEORY:Think Out of the Box
- INTRODUCTION TO DEBT, EFFICIENT MARKETS AND COST OF CAPITAL:Real Assets Markets, Debt vs. Equity
- WEIGHTED AVERAGE COST OF CAPITAL (WACC):Summary of Formulas
- BUSINESS RISK FACED BY FIRM, OPERATING LEVERAGE, BREAK EVEN POINT& RETURN ON EQUITY
- OPERATING LEVERAGE, FINANCIAL LEVERAGE, ROE, BREAK EVEN POINT AND BUSINESS RISK
- FINANCIAL LEVERAGE AND CAPITAL STRUCTURE:Capital Structure Theory
- MODIFICATIONS IN MILLAR MODIGLIANI CAPITAL STRUCTURE THEORY:Modified MM - With Bankruptcy Cost
- APPLICATION OF MILLER MODIGLIANI AND OTHER CAPITAL STRUCTURE THEORIES:Problem of the theory
- NET INCOME AND TAX SHIELD APPROACHES TO WACC:Traditionalists -Real Markets Example
- MANAGEMENT OF CAPITAL STRUCTURE:Practical Capital Structure Management
- DIVIDEND PAYOUT:Other Factors Affecting Dividend Policy, Residual Dividend Model
- APPLICATION OF RESIDUAL DIVIDEND MODEL:Dividend Payout Procedure, Dividend Schemes for Optimizing Share Price
- WORKING CAPITAL MANAGEMENT:Impact of working capital on Firm Value, Monthly Cash Budget
- CASH MANAGEMENT AND WORKING CAPITAL FINANCING:Inventory Management, Accounts Receivables Management:
- SHORT TERM FINANCING, LONG TERM FINANCING AND LEASE FINANCING:
- LEASE FINANCING AND TYPES OF LEASE FINANCING:Sale & Lease-Back, Lease Analyses & Calculations
- MERGERS AND ACQUISITIONS:Leveraged Buy-Outs (LBO’s), Mergers - Good or Bad?
- INTERNATIONAL FINANCE (MULTINATIONAL FINANCE):Major Issues Faced by Multinationals
- FINAL REVIEW OF ENTIRE COURSE ON FINANCIAL MANAGEMENT:Financial Statements and Ratios