 |

Cost
& Management Accounting
(MGT-402)
VU
LESSON#
9
ECONOMIC
ORDERING QUANTITY
Economic
order quantity refers to
that number (quantity)
ordered in a single purchase so
that the
accumulated
costs of ordering and carrying
costs are at the minimum
level.
In
other words, the quantity
that is ordered at one time
should be so, which will
minimize the total
of
(i) Cost of placing orders
and receiving the goods, and
(ii) cost of storing the
goods as well as
interest
on the capital invested.
The
economic order quantity can be determined
by the following simple
formula:
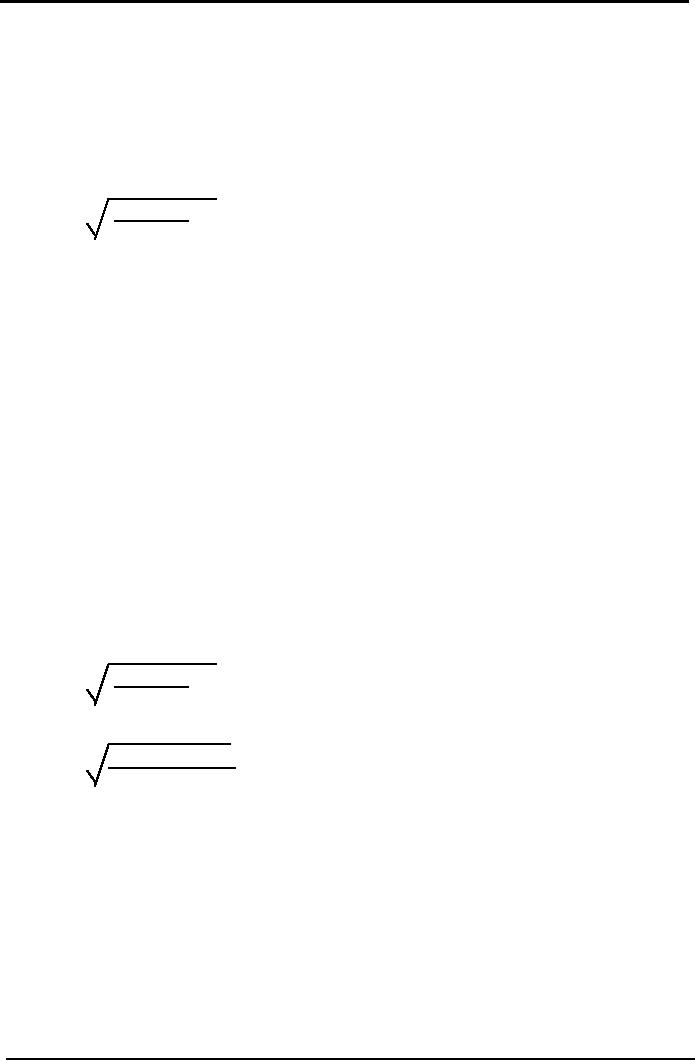
EOQ
=
2xRUxOC
UC
x CC%
Where;
EOQ
=
Economic
Order Quantity.
RU
=
Annually
Required Units.
OC
=
Ordering
Costs for one order.
UC
=
Inventory
Unit Cost.
CC
=
Carrying
Cost as %age of Unit
Cost.
This
formula is based on three
assumptions:
1.
Price will remain constant
throughout the year and
quantity discount is not
involved.
2.
Pattern of consumption, variable
ordering costs per order
and variable inventory
carrying
charge
per unit per annum
will remain the same
throughout, and
3.
EOQ will be delivered each time
the stock balance is just
reduced to nil.
The
Economic Order Quantity can
be determined by applying the formula as
under:
Suppose;
the
Annual
consumption is
80,000
units,
Cost
to place one order is
Rs.
1,200
Cost
per unit is
Rs.
50
Carrying
cost is
6%
of Unit cost
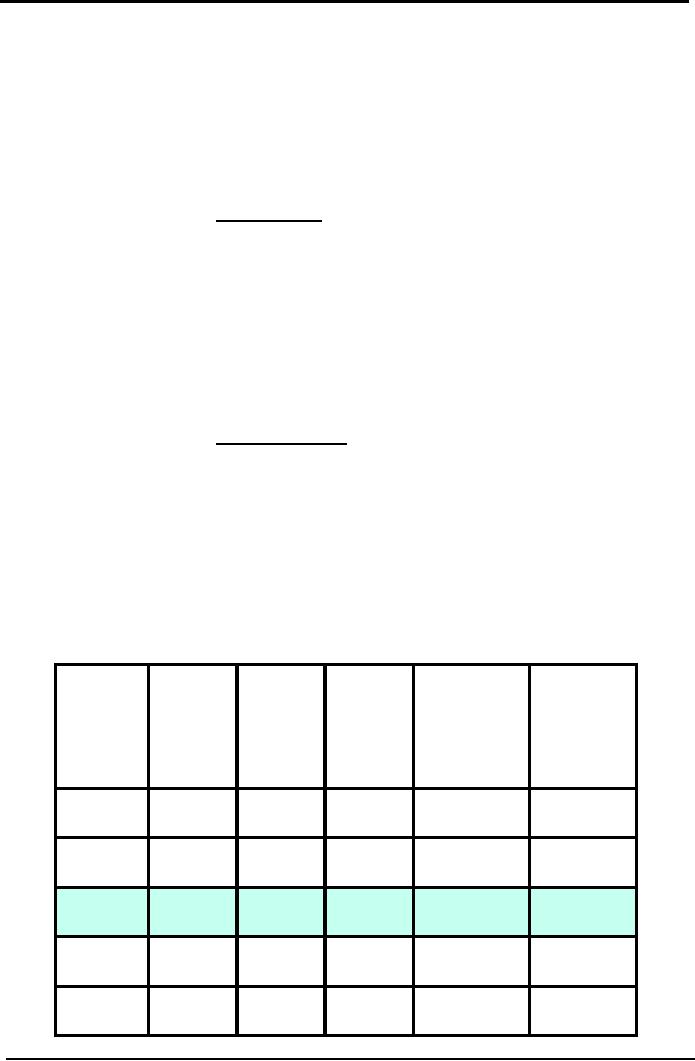
EOQ
=
2xRUxOC
UC
x CC%
EOQ
=
2
x 80,000 x 1,200
50x6%
EOQ
=
8,000
As
stated above this formula
holds good if changes in
price are not likely in
the near future
and
consumption
is regular. Otherwise, placing orders
according to this formula
may become
expensive.
Carrying
cost of inventory consists of
(i) the costs of physical
storage such as cost of
space,
handling
and upkeep expenses, insurance,
cost of obsolescence, etc.,
and (ii) interest on
capital
invested
(the opportunity cost of the
capital blocked up). All
these costs are expressed in
%age of
the
cost per unit.
Table
of EOQ
Economic
order quantity can also be
proved through a table, by calculating
total cost at
different
order
quantities.
56

Cost
& Management Accounting
(MGT-402)
VU
Following
is a table that is showing
total cost at five different
order quantities, assuming that
the
annual
requirement of the units to be consumed
remains the same. Here
the total cost
comprises
of
ordering cost and carrying
cost.
Total
Ordering cost
Ordering
cost is arrived by multiplying the
number of orders in a year
with the cost
per
order. Number of order is
calculated by dividing annually required
units by the
order
quantity.
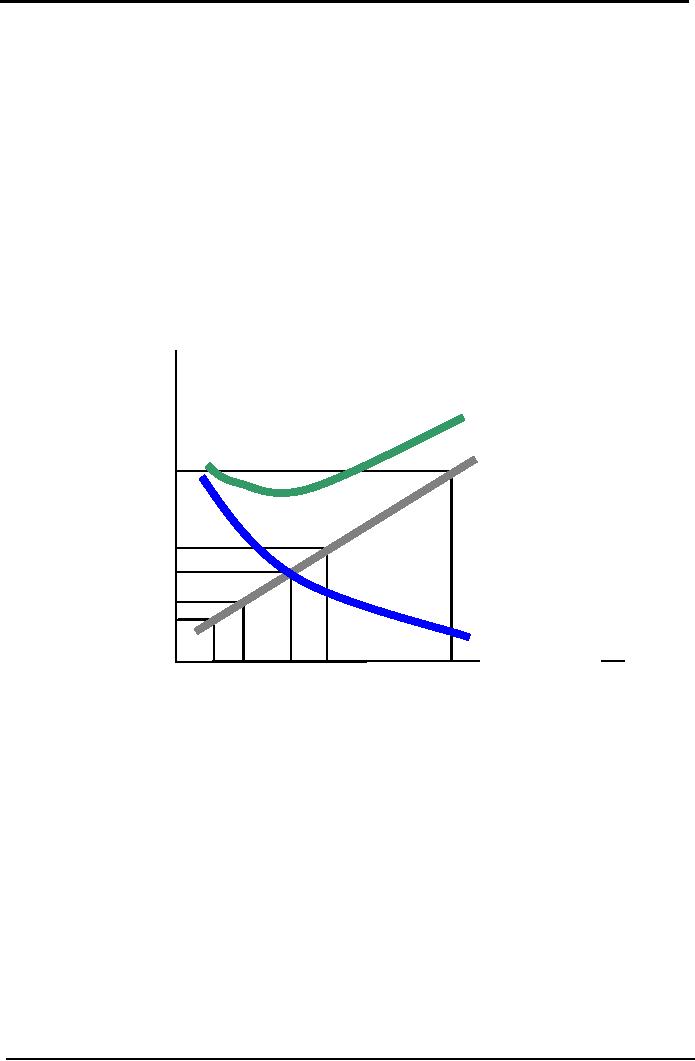
Step
I:
Required
Units = Number of
orders
Order
Quantity
Step
II: Number of orders x Cost
per order
Total
Carrying Cost
Carrying
cost is arrived by multiplying the
average ordering quantity
with the
carrying
cost per unit. Average
ordering quantity is calculated by
dividing the
ordering
quantity by 2. (It
is assumed that half of the ordering
quantity is always kept into
the
store,
this is the reason the ordering quantity
is divided by 2)
Step
I:
Ordering
Quantity = Average ordering
quantity
2
Step
II: Carrying cost per unit =
Unit Cost x CC %age
Step
III:
Average
ordering quantity x Carrying cost
per unit
Applying
these steps at different presumed
order quantities (inclusive of
the
Economic
Order Quantity) we can
develop a table.
Required
Number of Total Total
Carrying
Total
cost
Order
Cost
Quantity
Units
orders
Ordering
Avg
Order qty x
Cost
Number
of
Rs.3
orders
x
Rs.
1,200
20,000
80,000
4
4,800
30,000
34,800
10,000
80,000
8
9,600
15,000
24,600
8,000
80,000
10
12,000
12,000
24,000
5,000
80,000
16
19,200
7,500
26,700
4,000
80,000
20
24,000
6,000
30,000
57

Cost
& Management Accounting
(MGT-402)
VU
The
above table shows that
8,000 is the economic order
quantity because at this
point total
cost
is the minimum. At this
point total ordering cost is
equal to the total carrying
cost.
If
the order quantity is
increased it will although
result in reducing the total
ordering cost but
at
the same time more
carrying cost will be
incurred to store the
inventory.
Whereas
if the order quantity is
decreased it will although
result in reducing the total
carrying
cost
but at the same time
more ordering cost will be
incurred as the number of
orders will
increase.
EOQ
Graph
Economic
order quantity can also be
determined through a graph. Here the
above
information
is plotted in a graph for total
ordering cost, total carrying
cost and total cost
at
different
ordering quantities.
The
point at which the line of
total ordering cost
intersects with the total
carrying cost is the
EOQ.
At this point the line of
total cost will give a bend
that shows the minimum
cost.
COSTS
(000)
Total
Cost
36
30
Total
Carrying
Cost
24
18
12
6
Total
Ordering
Cost
4
8
10
20
5
ORDER
SIZE (Q) (000)
In
the above graph line of
total carrying cost intersects
line of total ordering cost
at 8,000 order
quantities,
where both of the costs are
Rs. 12,000. At this order
quantity the total cost is
Rs. 24,000
which
is the minimum most.
If
the order quantity is
increased or decreased the
total cost will be more
than the cost at
EOQ.
This
is also evident from the
above graph.
PROBLEMS
Q.
1
From
the following data, you
are required to determine the Economic
Order Quantity.
Annual
usage
8,000
units
Cost
per unit
Rs.
30
Ordering
cost
Rs.
7 per order
Storage
and carrying cost as percentage of
average inventory holding
15%
58

Cost
& Management Accounting
(MGT-402)
VU
Q.
2
What
is Economic Order Quantity
(EOQ)? Should the quantity
ordered be always equal to
EOQ?
Calculate
EOQ from the
following:
(a)
RU
600
units
{b)
Ordering
cost
Rs,
12 per order
(c)
Carrying cost
20%
(d)
Price
per unit
Rs.
20.
Q.
3
Annual
requirement of Glass Limited is
100,000 units of product
10mm glass. Per unit
cost of the
product
is Rs. 10 and cost for
each new order is Rs.
100. Carrying cost is
50%.
Required:
Calculate
EOQ by table and by graph.
MULTIPLE
CHOICE QUESTIONS
Q.
1
The
demand for a product is
12,500 units for a three
month period. Each unit of product
has a
purchase
price of Rs.15 and ordering
costs are Rs.20 per
order placed.
The
annual holding cost of one
unit of product is 10% of its
purchase price.
What
is the Economic Order
Quantity (to the nearest
unit)?
A
1,577
B
1,816
C
1,866
D
1,155
Q.
2
A
company determines its order
quantity for a raw material by using
the Economic Order
Quantity
(EOQ)
model.
What
would be the effects of a decrease in
the cost of ordering a batch
of raw material on the
ordering
quantity and
the total
carrying cost?
Ordering
quantity
Total
carrying cost
A
Higher
Lower
B
Higher
Higher
C
Lower
Higher
D
Lower
Lower
Q.
3
A
company uses the Economic
Order Quantity (EOQ) model
to establish reorder quantities.
The
following information relates to
the forthcoming period:
Order
costs
Rs.25
per order
Carrying
costs
10%
of purchase price
Annual
demand
20,000
units
Purchase
price
Rs.40
per unit
EOQ
500
units
What
are the total annual
costs of stock (i.e. the
total purchase cost plus
total order cost
plus
total
holding cost)?
A
Rs.
22,000
B
Rs.
33,500
C
Rs.
802,000
D
Rs.
803,000
59
Table of Contents:
- COST CLASSIFICATION AND COST BEHAVIOR INTRODUCTION:COST CLASSIFICATION,
- IMPORTANT TERMINOLOGIES:Cost Center, Profit Centre, Differential Cost or Incremental cost
- FINANCIAL STATEMENTS:Inventory, Direct Material Consumed, Total Factory Cost
- FINANCIAL STATEMENTS:Adjustment in the Entire Production, Adjustment in the Income Statement
- PROBLEMS IN PREPARATION OF FINANCIAL STATEMENTS:Gross Profit Margin Rate, Net Profit Ratio
- MORE ABOUT PREPARATION OF FINANCIAL STATEMENTS:Conversion Cost
- MATERIAL:Inventory, Perpetual Inventory System, Weighted Average Method (W.Avg)
- CONTROL OVER MATERIAL:Order Level, Maximum Stock Level, Danger Level
- ECONOMIC ORDERING QUANTITY:EOQ Graph, PROBLEMS
- ACCOUNTING FOR LOSSES:Spoiled output, Accounting treatment, Inventory Turnover Ratio
- LABOR:Direct Labor Cost, Mechanical Methods, MAKING PAYMENTS TO EMPLOYEES
- PAYROLL AND INCENTIVES:Systems of Wages, Premium Plans
- PIECE RATE BASE PREMIUM PLANS:Suitability of Piece Rate System, GROUP BONUS SYSTEMS
- LABOR TURNOVER AND LABOR EFFICIENCY RATIOS & FACTORY OVERHEAD COST
- ALLOCATION AND APPORTIONMENT OF FOH COST
- FACTORY OVERHEAD COST:Marketing, Research and development
- FACTORY OVERHEAD COST:Spending Variance, Capacity/Volume Variance
- JOB ORDER COSTING SYSTEM:Direct Materials, Direct Labor, Factory Overhead
- PROCESS COSTING SYSTEM:Data Collection, Cost of Completed Output
- PROCESS COSTING SYSTEM:Cost of Production Report, Quantity Schedule
- PROCESS COSTING SYSTEM:Normal Loss at the End of Process
- PROCESS COSTING SYSTEM:PRACTICE QUESTION
- PROCESS COSTING SYSTEM:Partially-processed units, Equivalent units
- PROCESS COSTING SYSTEM:Weighted average method, Cost of Production Report
- COSTING/VALUATION OF JOINT AND BY PRODUCTS:Accounting for joint products
- COSTING/VALUATION OF JOINT AND BY PRODUCTS:Problems of common costs
- MARGINAL AND ABSORPTION COSTING:Contribution Margin, Marginal cost per unit
- MARGINAL AND ABSORPTION COSTING:Contribution and profit
- COST – VOLUME – PROFIT ANALYSIS:Contribution Margin Approach & CVP Analysis
- COST – VOLUME – PROFIT ANALYSIS:Target Contribution Margin
- BREAK EVEN ANALYSIS – MARGIN OF SAFETY:Margin of Safety (MOS), Using Budget profit
- BREAKEVEN ANALYSIS – CHARTS AND GRAPHS:Usefulness of charts
- WHAT IS A BUDGET?:Budgetary control, Making a Forecast, Preparing budgets
- Production & Sales Budget:Rolling budget, Sales budget
- Production & Sales Budget:Illustration 1, Production budget
- FLEXIBLE BUDGET:Capacity and volume, Theoretical Capacity
- FLEXIBLE BUDGET:ANALYSIS OF COST BEHAVIOR, Fixed Expenses
- TYPES OF BUDGET:Format of Cash Budget,
- Complex Cash Budget & Flexible Budget:Comparing actual with original budget
- FLEXIBLE & ZERO BASE BUDGETING:Efficiency Ratio, Performance budgeting
- DECISION MAKING IN MANAGEMENT ACCOUNTING:Spare capacity costs, Sunk cost
- DECISION MAKING:Size of fund, Income statement
- DECISION MAKING:Avoidable Costs, Non-Relevant Variable Costs, Absorbed Overhead
- DECISION MAKING CHOICE OF PRODUCT (PRODUCT MIX) DECISIONS
- DECISION MAKING CHOICE OF PRODUCT (PRODUCT MIX) DECISIONS:MAKE OR BUY DECISIONS