 |
6
Security
& Monitoring
In a
traditional wired network,
access control is very
straightforward: If a
person
has physical access to a
computer or network hub,
they can use
(or
abuse)
the network resources. While
software mechanisms are an
impor-
tant
component of network security,
limiting physical access to
the network
devices
is the ultimate access
control mechanism. Simply
put, if all termi-
nals
and network components are
only accessible to trusted
individuals, the
network
can likely be
trusted.
The
rules change significantly
with wireless networks.
While the
apparent
range
of your access point may
seem to be just a few
hundred meters, a
user
with
a high gain antenna may be
able to make use of the
network from several
blocks
away. Should an unauthorized
user be detected, is impossible to
sim-
ply
"trace the cable" back to
the user s
location.
Without transmitting a
single
packet,
a nefarious user can even
log all network data to
disk. This data
can
later
be used to launch a more
sophisticated attack against
the network.
Never
assume that radio waves
simply "stop" at the edge of
your property line.
It
is usually unreasonable to completely
trust all users of the
network, even on
wired
networks. Disgruntled employees,
uneducated network users,
and sim-
ple
mistakes on the part of
honest users can cause
significant harm to
network
operations.
As the network architect,
your goal is to facilitate
private commu-
nication
between legitimate users of
the network. While a certain
amount of
access
control and authentication is
necessary in any network,
you have failed
in
your job if legitimate users
find it difficult to use the
network to communicate.
There
s an old
saying that the only
way to completely secure a
computer is to
unplug
it, lock it in a safe,
destroy the key, and
bury the whole thing in
con-
157
158
Chapter
6: Security & Monitoring
crete.
While such a system might be
completely "secure", it is useless
for
communication.
When you make security
decisions for your network,
re-
member
that above all else,
the network exists so that
its users can
commu-
nicate
with each other. Security
considerations are important,
but should not
get
in the way of the network
s users.
Physical
security
When
installing a network, you
are building an infrastructure
that people de-
pend
on. Security measures exist
to ensure that the network
is reliable. For
many
installations, outages often
occur due to human
tampering, whether
accidental
or not. Networks have
physical components, such as
wires and
boxes,
which are easily disturbed.
In many installations, people
will not un-
derstand
the purpose of the installed
equipment, or curiosity may
lead them
to
experiment. They may not
realize the importance of a
cable connected to
a
port. Someone may unplug an
Ethernet cable so that they
can connect
their
laptop for 5 minutes, or
move a switch because it is in
their way. A plug
might
be removed from a power bar
because someone needs that
recepta-
cle.
Assuring the physical
security of an installation is paramount.
Signs and
labels
will only be useful to those
who can read your
language. Putting
things
out
of the way and limiting
access is the best means to
assure that accidents
and
tinkering do not
occur.
In
less developed economies,
proper fasteners, ties, or
boxes will not be as
easy
to find.
You should be able to find electrical
supplies that will work
just
as
well. Custom enclosures are
also easy to manufacture and
should be
considered
essential to any installation. It is
often economical to pay a
mason
to
make holes and install
conduit. Where this would be
an expensive option
in
the developed world, this
type of labour intensive
activity can be
affordable
in
Southern countries. PVC can
be embedded in cement walls
for passing
cable
from room to room. This
avoids the need to smash
new holes every
time
a cable needs to be passed.
Plastic bags can be stuffed
into the conduit
around
the cables for
insulation.
Small
equipment should be mounted on
the wall and larger
equipment
should
be put in a closet or in a
cabinet.
Switches
Switches,
hubs or interior access
points can be screwed
directly onto a wall
with
a wall plug. It is best to
put this equipment as high
as possible to reduce
the
chance that someone will
touch the device or its
cables.
Chapter
6: Security & Monitoring
159
Cables
At
the very least, cables
should be hidden and fastened. It is
possible to find
plastic
cable conduit that can be
used in buildings. If you cannot
find it, simple
cable
attachments can be nailed
into the wall to secure
the cable. This will
make
sure
that the cable doesn't
hang where it can be
snagged, pinched or
cut.
It
is preferable to bury cables,
rather than to leave them
hanging across a
yard.
Hanging wires might be used
for drying clothes, or be
snagged by a
ladder,
etc. To avoid vermin and
insects, use plastic
electrical conduit.
The
marginal
expense will be well worth
the trouble. The conduit
should be buried
about
30 cm deep, or below the
frost level in cold
climates. It is worth
the
extra
investment of buying larger
conduit than is presently
required, so that
future
cables can be run through
the same tubing. Consider
labeling buried
cable
with a "call before you
dig" sign to avoid future
accidental outages.
Power
It
is best to have power bars
locked in a cabinet. If that is
not possible, mount
the
power bar under a desk, or
on the wall and use
duct tape (or gaffer tape,
a
strong
adhesive tape) to secure the
plug into the receptacle. On
the UPS and
power
bar, do not leave any
empty receptacles. Tape them
if necessary. Peo-
ple
will have the tendency to
use the easiest receptacle,
so make these
critical
ones
difficult to use. If you do
not, you might find a
fan or light plugged
into
your
UPS; though it is nice to
have light, it is nicer to
keep your server
running!
Water
Protect
your equipment from water
and moisture. In all cases
make sure that
your
equipment, including your
UPS is at least 30 cm from
the ground, to
avoid
damage from flooding.
Also try to have a roof
over your equipment,
so
that
water and moisture will
not fall onto it. In
moist climates, it is
important
that
the equipment has proper
ventilation to assure that
moisture can be ex-
hausted.
Small closets need to have
ventilation, or moisture and
heat can
degrade
or destroy your gear.
Masts
Equipment
installed on a mast is often
safe from thieves.
Nevertheless, to de-
ter
thieves and to keep your
equipment safe from winds it
is good to over-
engineer
mounts. Painting equipment a
dull white or grey color
reflects the sun
and
makes it look plain and
uninteresting. Panel antennas
are often preferred
because
they are much more
subtle and less interesting
than dishes. Any
in-
stallation
on walls should be high
enough to require a ladder to
reach. Try
choosing
well-lit but not prominent
places to put equipment.
Also avoid anten-
160
Chapter
6: Security & Monitoring
nae
that resemble television
antennae, as those are items
that will attract
in-
terest
by thieves, where a wifi
antenna will be useless to
the average thief.
Threats
to the network
One
critical difference between
Ethernet and wireless is
that wireless
networks
are
built on a shared
medium. They
more closely resemble the
old network
hubs
than modern switches, in
that every computer
connected to the
network
can
"see" the traffic of every
other user. To monitor all
network traffic on an
access
point, one can simply
tune to the channel being
used, put the
network
card
into monitor mode, and
log every frame. This
data might be directly
valu-
able
to an eavesdropper (including data
such as email, voice data,
or online
chat
logs). It may also provide
passwords and other
sensitive data, making
it
possible
to compromise the network
even further. As we ll see
later in this
chapter,
this problem can be
mitigated by the use of
encryption.
Another
serious problem with
wireless networks is that
its users are
relatively
anonymous. While it is
true that every wireless
device includes a
unique
MAC
address that is supplied by
the manufacturer, these
addresses can of-
ten
be changed with software.
Even when the MAC
address is known, it
can
be
very difficult to
judge where a wireless user
is physically located.
Multi-
path
effects, high-gain antennas,
and widely varying radio
transmitter charac-
teristics
can make it impossible to
determine if a malicious wireless
user is
sitting
in the next room or is in an
apartment building a mile
away.
While
unlicensed spectrum provides a
huge cost savings to the
user, it has
the
unfortunate side effect that
denial
of service (DoS) attacks
are trivially
simple.
By simply turning on a high
powered access point,
cordless phone,
video
transmitter, or other 2.4 GHz
device, a malicious person
could cause
significant
problems on the network.
Many network devices are
vulnerable to
other
forms of denial of service
attacks as well, such as
disassociation flood-
ing
and ARP table
overflows.
Here
are several categories of
individuals who may cause
problems on a
wireless
network:
�
Unintentional
users. As more
wireless networks are
installed in densely
populated
areas, it is common for
laptop users to accidentally
associate to
the
wrong network. Most wireless
clients will simply choose
any available
wireless
network when their preferred
network is unavailable. The
user
may
then make use of this
network as usual, completely
unaware that they
may
be transmitting sensitive data on
someone else s
network.
Malicious
people
may even take advantage of
this by setting up access
points in stra-
tegic
locations, to try to attract
unwitting users and capture
their data.
Chapter
6: Security & Monitoring
161
The
first
step in avoiding this
problem is educating your
users, and stress-
ing
the importance of connecting
only to known and trusted
networks.
Many
wireless clients can be
configured to
only connect to trusted
net-
works,
or to ask permission before
joining a new network. As we
will see
later
in this chapter, users can
safely connect to open
public networks by
using
strong encryption.
�
War
drivers. The
"war driving" phenomenon
draws its name from
the
popular
1983 hacker film,
"War Games". War drivers
are interested in find-
ing
the physical location of
wireless networks. They
typically drive
around
with
a laptop, GPS, and
omnidirectional antenna, logging
the name and
location
of any networks they find.
These logs are then
combined with logs
from
other war drivers, and
are turned into graphical
maps depicting the
wireless
"footprint" of a particular
city.
The
vast majority of war drivers
likely pose no direct threat
to networks, but
the
data they collect might be
of interest to a network cracker.
For example,
it
might be obvious that an
unprotected access point
detected by a war
driver
is
located inside a sensitive
building, such as a government or
corporate of-
fice.
A malicious person could use
this information to illegally
access the
network
there. Arguably, such an AP
should never have been
set up in the
first
place, but war driving
makes the problem all
the more urgent. As we
will
see
later in this chapter, war
drivers who use the
popular program
NetStum-
bler
can be detected with
programs such as Kismet. For
more information
about
war driving, see sites
such as http://www.wifimaps.com/,
http://www.nodedb.com/,
or http://www.netstumbler.com/
.
�
Rogue
access points. There
are two general classes of
rogue access
points:
those incorrectly installed by
legitimate users, and those
installed
by
malicious people who intend
to collect data or do harm to
the network.
In
the simplest case, a
legitimate network user may
want better wireless
coverage
in their office, or
they might find security
restrictions on the
corpo-
rate
wireless network too
difficult to
comply with. By installing an
inexpen-
sive
consumer access point
without permission, the user
opens the entire
network
up to potential attacks from
the inside. While it is
possible to scan
for
unauthorized access points on
your wired network, setting
a clear policy
that
prohibits them is very
important.
The
second class of rogue access
point can be very difficult
to deal with. By
installing
a high powered AP that uses
the same ESSID as an
existing net-
work,
a malicious person can trick
people into using their
equipment, and log
or
even manipulate all data
that passes through it.
Again, if your users
are
trained
to use strong encryption,
this problem is significantly
reduced.
�
Eavesdroppers. As
mentioned earlier, eavesdropping is a
very difficult
problem
to deal with on wireless
networks. By using a passive
monitoring
tool
(such as Kismet), an eavesdropper
can log all network
data from a
great
distance away, without ever
making their presence known.
Poorly
162
Chapter
6: Security & Monitoring
encrypted
data can simply be logged
and cracked later, while
unencrypted
data
can be easily read in real
time.
If
you have difficulty
convincing others of this
problem, you might want
to
demonstrate
tools such as Etherpeg
(http://www.etherpeg.org/) or
Driftnet
(http://www.ex-parrot.com/~chris/driftnet/). These
tools watch a
wireless
network
for graphical data, such as
GIF and JPEG files.
While other users
are
browsing the Internet, these
tools simply display all
graphics found in a
graphical
collage. I often use tools
such as this as a demonstration
when
lecturing
on wireless security. While
you can tell a user
that their email is
vulnerable
without encryption, nothing
drives the message home
like show-
ing
them the pictures they
are looking at in their web
browser.
Again,
while it cannot be completely
prevented, proper application of
strong
encryption
will discourage
eavesdropping.
This
introduction is intended to give
you an idea of the problems
you are up
against
when designing a wireless
network. Later in this
chapter, we will look
at
tools and techniques that
will help you to mitigate
these problems.
Authentication
Before
being granted access to
network resources, users
should first
be
authenticated. In an ideal
world, every wireless user
would have an identi-
fier that is
unique, unchangeable, and
cannot be impersonated by other
us-
ers.
This turns out to be a very
difficult
problem to solve in the real
world.
The
closest feature we have to a
unique identifier is the
MAC address. This
is
the 48-bit number assigned
by the manufacturer to every
wireless and
Ethernet
device. By employing mac
filtering
on our
access points, we can
authenticate
users based on their MAC
address. With this feature,
the ac-
cess
point keeps an internal
table of approved MAC
addresses. When a
wireless
user tries to associate to
the access point, the
MAC address of the
client
must be on the approved
list, or the association
will be denied.
Alter-
nately,
the AP may keep a table of
known "bad" MAC addresses,
and permit
all
devices that are not on
the list.
Unfortunately,
this is not an ideal
security mechanism. Maintaining
MAC ta-
bles
on every device can be
cumbersome, requiring all
client devices to
have
their
MAC addresses recorded and
uploaded to the APs. Even
worse, MAC
addresses
can often be changed in
software. By observing MAC
addresses
in
use on a wireless network, a
determined attacker can
spoof
(impersonate)
an
approved MAC address and
successfully associate to the
AP. While MAC
filtering
will prevent unintentional
users and even most
curious individuals
from
accessing the network, MAC
filtering
alone cannot prevent attacks
from
determined
attackers.
Chapter
6: Security & Monitoring
163
MAC
filters are useful for
temporarily limiting access
from misbehaving
clients.
For
example, if a laptop has a
virus that sends large
amounts of spam or
other
traffic,
its MAC address can be
added to the filter table to
stop the traffic
imme-
diately.
This will buy you
time to track down the
user and fix the
problem.
Another
popular authentication feature of
wireless the so-called
closed
net-
work. In a typical
network, APs will broadcast
their ESSID many times
per
second,
allowing wireless clients
(as well as tools such as
NetStumbler) to
find the
network and display its
presence to the user. In a
closed network,
the
AP does not beacon the
ESSID, and users must
know the full name
of
the
network before the AP will
allow association. This
prevents casual users
from
discovering the network and
selecting it in their wireless
client.
There
are a number of drawbacks to
this feature. Forcing users
to type in
the
full ESSID before connecting
to the network is error
prone and often
leads
to support calls and
complaints. Since the
network isn t
obviously
pre-
sent
in site survey tools like
NetStumbler, this can
prevent your networks
from
showing up on war driving
maps. But it also means
that other network
builders
cannot easily find your
network either, and
specifically
won t
know
that
you are already using a
given channel. A conscientious
neighbor may
perform
a site survey, see no nearby
networks, and install their
own network
on
the same channel you
are using. This will
cause interference
problems
for
both you and your
neighbor.
Finally,
using closed networks
ultimately adds little to
your overall networks
security.
By using passive monitoring
tools (such as Kismet), a
skilled user
can
detect frames sent from
your legitimate clients to
the AP. These
frames
necessarily
contain the network name. A
malicious user can then
use this
name
to associate to the access
point, just like a normal
user would.
Encryption
is probably the best tool we
have for authenticating
wireless us-
ers.
Through strong encryption, we
can uniquely identify a user
in a manner
that
is very difficult to
spoof, and use that
identity to determine further
net-
work
access. Encryption also has
the benefit of adding a
layer of privacy by
preventing
eavesdroppers from easily
watching network traffic.
The
most widely employed
encryption method on wireless
networks is WEP
encryption. WEP
stands for wired
equivalent privacy, and is
supported by
virtually
all 802.11a/b/g equipment.
WEP uses a shared 40-bit
key to encrypt
data
between the access point
and client. The key
must be entered on
the
APs
as well as on each of the
clients. With WEP enabled,
wireless clients
cannot
associate with the AP until
they use the correct
key. An eavesdropper
listening
to a WEP-enabled network will
still see traffic and
MAC addresses,
but
the data payload of each
packet is encrypted. This
provides a fairly
good
authentication
mechanism while also adding
a bit of privacy to the
network.
164
Chapter
6: Security & Monitoring
WEP
is definitely
not the strongest encryption
solution available. For
one
thing,
the WEP key is shared
between all users. If the
key is compromised
(say,
if one user tells a friend
what the password is, or if
an employee is let
go)
then changing the password
can be prohibitively difficult,
since all APs
and
client devices need to be
changed. This also means
that legitimate us-
ers
of the network can still
eavesdrop on each others
traffic, since
they all
know
the shared key.
The
key itself is often poorly
chosen, making offline
cracking attempts
feasi-
ble.
Even worse, the
implementation of WEP itself is
broken in many access
points,
making it even easier to
crack some networks. While
manufacturers
have
implemented a number of extensions to
WEP (such as longer keys
and
fast
rotation schemes), these
extensions are not part of
the standard, and
generally
will not interoperate
between equipment from
different manufactur-
ers.
By upgrading to the most
recent firmware
for all of your wireless
de-
vices,
you can prevent some of
the early attacks found in
WEP.
WEP
can still be a useful
authentication tool. Assuming
your users can be
trusted
not to give away the
password, you can be fairly
sure that your
wire-
less
clients are legitimate.
While WEP cracking is
possible, it is beyond
the
skill
of most users. WEP is quite
useful for securing long
distance point-to-
point
links, even on generally
open networks. By using WEP
on such a link,
you
will discourage others from
associating to the link, and
they will likely
use
other
available APs instead. Think
of WEP as a handy "keep out"
sign for
your
network. Anyone who
detects the network will
see that a key is
re-
quired,
making it clear that they
are not welcome to use
it.
WEPs
greatest strength is its
interoperability. In order to
comply with the
802.11
standards, all wireless
devices support basic WEP.
While it isn t
the
strongest
method available, it is certainly
the most commonly
implemented
encryption
feature. We will look at
other more advanced
encryption techniques
later
in this chapter.
For
more details about the
state of WEP encryption, see
these papers:
�
http://www.isaac.cs.berkeley.edu/isaac/wep-faq.html
�
http://www.cs.umd.edu/~waa/wireless.pdf
�
http://www.crypto.com/papers/others/rc4_ksaproc.ps
Another
data-link layer authentication
protocol is Wi-Fi
Protected Access, or
WPA. WPA
was created specifically to
deal with the known
problems with
WEP
mentioned earlier.
It
provides a significantly
stronger encryption
scheme,
and can use a shared
private key, unique keys
assigned to each
user,
or even SSL certificates to
authenticate both the client
and the access
point.
Authentication credentials are
checked using the 802.1X
protocol,

Chapter
6: Security & Monitoring
165
which
can consult a third party
database such as RADIUS.
Through the use
of
Temporal
Key Integrity Protocol
(TKIP), keys
can be rotated
quickly
over
time, further reducing the
likelihood that a particular
session can be
cracked.
Overall, WPA provides
significantly
better authentication and
pri-
vacy
than standard WEP.
WPA
requires fairly recent
access point hardware and
up-to-date firmware
on
all
wireless clients, as well as a
substantial amount of configuration.
If you
are
installing a network in a setting
where you control the
entire hardware
platform,
WPA can be ideal. By
authenticating both clients
and APs, it solves
the
rogue access point problem
and provides many
significant
advantages
over
WEP. But in most network
settings where the vintage
of hardware is
mixed
and the knowledge of
wireless users is limited,
WPA can be a night-
mare
to install. It is for this
reason that most sites
continue to use WEP,
if
encryption
is used at all.
Captive
portals
One
common authentication tool
used on wireless networks is
the captive
portal. A captive
portal uses a standard web
browser to give a wireless
user
the
opportunity to present login
credentials. It can also be
used to present
information
(such as an Acceptable Use
Policy) to the user before
granting
further
access. By using a web
browser instead of a custom
program for
authentication,
captive portals work with
virtually all laptops and
operating
systems.
Captive portals are
typically used on open
networks with no
other
authentication
methods (such as WEP or MAC
filters).
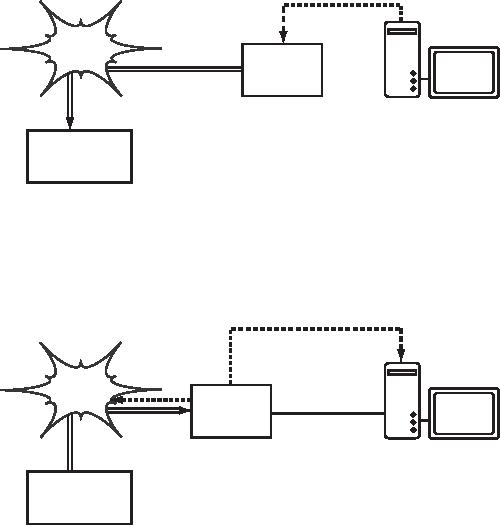
To
begin, a wireless user opens
their laptop and selects
the network. Their
computer
requests a DHCP lease, which
is granted. They then use
their web
browser
to go to any site on the
Internet.
http://google.com/
Captive
Internet
portal
Login:
Figure
6.1: The user requests a
web page and is
redirected.
Instead
of receiving the requested
page, the user is presented
with a login
screen.
This page can require
the user to enter a user
name and password,
simply
click a "login" button, type
in numbers from a pre-paid
ticket, or enter
any
other credentials that the
network administrators require.
The user then
166
Chapter
6: Security & Monitoring
enters
their credentials, which are
checked by the access point
or another
server
on the network. All other
network access is blocked
until these cre-
dentials
are verified.
HTTP
request waiting
Internet
Captive
portal
User:
joe
Password:
secret
Authentication
service
Figure
6.2: The user's credentials
are verified
before further network
access is
granted.
The authentication server
can be the access point
itself, another
machine
on
the local network, or a
server anywhere on the
Internet.
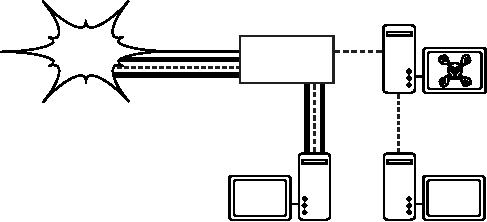
Once
authenticated, the user is
permitted to access network
resources, and
is
typically redirected to the
site they originally
requested.
Redirect
to http://google.com/
Internet
Captive
portal
Credentials
http://google.com/
verified.
Authentication
service
Figure
6.3: After authenticating,
the user is permitted to
access the rest
of
the network.
Captive
portals provide no encryption
for the wireless users,
instead relying
on
the MAC and IP address of
the client as a unique
identifier.
Since this is
not
necessarily very secure,
many implementations will
require the user to
re-authenticate
periodically. This can often
be automatically done by
mini-
mizing
a special pop-up browser
window when the user
first
logs in.
Since
they do not provide strong
encryption, captive portals
are not a very
good
choice for networks that
need to be locked down to
only allow access
Chapter
6: Security & Monitoring
167
from
trusted users. They are
much more suited to cafes,
hotels, and other
public
access locations where
casual network users are
expected.
In
public or semi-public network
settings, encryption techniques
such as
WEP
and WPA are effectively
useless. There is simply no
way to distribute
public
or shared keys to members of
the general public without
compromis-
ing
the security of those keys.
In these settings, a simple
application such as
a
captive portal provides a
level of service somewhere
between completely
open
and completely
closed.
Popular
hotspot projects
�
Chillispot (http://www.chillispot.info/).
Chillispot is a captive portal
de-
signed
to authenticate against an existing
user credentials database,
such
as
RADUIS. Combined with the
application phpMyPrePaid, pre-paid
ticket
based
authentication can be implemented
very easily You can
download
phpMyPrePaid
from http://sourceforge.net/projects/phpmyprepaid/.
�
WiFi Dog (http://www.wifidog.org/). WiFi
Dog provides a very
complete
captive
portal authentication package in
very little space (typically
under
30kb).
From a user s
perspective,
it requires no pop-up or javascript
sup-
port,
allowing it to work on a wider
variety of wireless
devices.
�
m0n0wall (http://m0n0.ch/wall/). m0n0wall is
a complete embedded
oper-
ating
system based on FreeBSD. It
includes a captive portal
with RADIUS
support,
as well as a PHP web
server.
�
NoCatSplash (http://nocat.net/download/NoCatSplash/) provides a
cus-
tomizable
splash page to your users,
requiring them to click a
"login" button
before
using the network. This is
useful for identifying the
operators of the
network
and displaying rules for
network access. It provides a
very easy
solution
in situations where you need
to provide users of an open
network
with
information and an acceptable
use policy.
Privacy
Most
users are blissfully unaware
that their private email,
chat conversations,
and
even passwords are often
sent "in the clear"
over dozens of
untrusted
networks
before arriving at their
ultimate destination on the
Internet. How-
ever
mistaken they may be,
users still typically have
some expectation of
privacy
when using computer
networks.
Privacy
can be achieved, even on
untrusted networks such as
public access
points
and the Internet. The
only proven effective method
for protecting pri-
vacy
is the use of strong
end-to-end
encryption.
168
Chapter
6: Security & Monitoring
Encryption
techniques such as WEP and
WPA attempt to address the
privacy
issue
at layer two, the data-link
layer. This does protect
against eavesdrop-
pers
listening in on the wireless
connection, but this
protection ends at
the
access
point. If the wireless
client uses insecure
protocols (such as POP
or
simple
SMTP for receiving and
sending email), then users
beyond the AP
can
still log the session
and see the sensitive
data. As mentioned
earlier,
WEP
also suffers from the
fact that it uses a shared
private key. This
means
that
legitimate wireless users
can eavesdrop on each other,
since they all
know
the private key.
By
using encryption to the
remote end of the
connection, users can
neatly
sidestep
the entire problem. These
techniques work well even on
untrusted
public
networks, where eavesdroppers
are listening and possibly
even ma-
nipulating
data coming from the
access point.
To
ensure data privacy, good
end-to-end encryption should
provide the fol-
lowing
features:
�
Verified
authentication of the remote
end. The
user should be able
to
know
without a doubt that the
remote end is who it claims
to be. Without
authentication,
a user could give sensitive
data to anyone claiming to
be
the
legitimate service.
�
Strong
encryption methods. The
encryption algorithm should
stand up
to
public scrutiny, and not be
easily decrypted by a third
party. There is no
security
in obscurity, and strong
encryption is even stronger
when the algo-
rithm
is widely known and subject
to peer review. A good
algorithm with a
suitably
large and protected key
can provide encryption that
is unlikely to
be
broken by any effort in our
lifetimes using current
technology.
�
Public
key cryptography. While
not an absolute requirement
for end-to-
end
encryption, the use of
public key cryptography
instead of a shared
key
can
ensure that an individual's
data remains private, even
if the key of an-
other
user of the service is
compromised. It also solves
certain problems
with
distributing keys to users
over untrusted
networks.
�
Data
encapsulation. A good
end-to-end encryption mechanism
protects
as
much data as possible. This
can range from encrypting a
single email
transaction
to encapsulation of all IP
traffic, including
DNS lookups and
other
supporting protocols. Some
encryption tools simply
provide a secure
channel
that other applications can
use. This allows users to
run any pro-
gram
they like and still
have the protection of
strong encryption, even if
the
programs
themselves don t
support
it.
Be
aware that laws regarding
the use of encryption vary
widely from place to
place.
Some countries treat
encryption as munitions, and
may require a
permit,
escrow of private keys, or
even prohibit its use
altogether. Before
Chapter
6: Security & Monitoring
169
implementing
any solution that involves
encryption, be sure to verify
that use
of
this technology is permitted in
your local area.
In
the following sections, we ll
take a look at some
specific tools
that can pro-
vide
good protection for your
users data.
SSL
The
most widely available
end-to-end encryption technology is
Secure
Sockets
Layer, known
simply as SSL. Built
into virtually all web
browsers,
SSL
uses public key cryptography
and a trusted public
key infrastructure
(PKI) to secure
data communications on the
web. Whenever you visit a
web
URL
that starts with https,
you are using
SSL.
The
SSL implementation built
into web browsers includes a
collection of cer-
tificates
from trusted sources, called
certificate
authorities (CA).
These
certificates
are cryptographic keys that
are used to verify the
authenticity of
websites.
When you browse to a website
that uses SSL, the
browser and
the
server first
exchange certificates.
The browser then
verifies that
the cer-
tificate
provided by the server
matches its DNS host
name, that it has
not
expired,
and that it is signed by a
trusted certificate
authority. The server
optionally
verifies the
identity of the browser s certificate.
If the certificates
are
approved, the browser and
server then negotiate a
master session key
using
the previously exchanged
certificates to
protect it. That key
is then
used
to encrypt all communications
until the browser
disconnects. This
kind
of
data encapsulation is known as a
tunnel.
The
tunnel can
terminate
Eavesdroppers
can watch
anywhere
on the Internet.
unencrypted
wireless traffic.
Internet
Access
point
Wireless
traffic is protected
by
an encrypted tunnel.
Figure
6.4: Eavesdroppers must break
strong encryption to monitor
traffic
over an
encrypted
tunnel. The conversation
inside the tunnel is
identical to any other
unen-
crypted
conversation.
The
use of certificates
with a PKI not only
protects the communication
from
eavesdroppers,
but also prevents so-called
man-in-the-middle
(MITM)
at-

170
Chapter
6: Security & Monitoring
tacks.
In a man-in-the-middle attack, a
malicious user intercepts
all commu-
nication
between the browser and
the server. By presenting
counterfeit cer-
tificates
to both the browser and
the server, the malicious
user could carry on
two
simultaneous encrypted sessions.
Since the malicious user
knows the
secret
on both connections, it is trivial to
observe and manipulate data
pass-
ing
between the server and
the browser.
Server
Man-in-the-middle
User
Figure
6.5: The man-in-the-middle
effectively controls everything
the user sees,
and
can
record and manipulate all
traffic. Without a public key
infrastructure to verify
the
authenticity
of keys, strong encryption
alone cannot protect against
this kind of
attack.
Use
of a good PKI prevents this
kind of attack. In order to be
successful, the
malicious
user would have to present a
certificate to
the client that is
signed
by
a trusted certificate
authority. Unless a CA has
been compromised
(very
unlikely)
or the user is tricked into
accepting the forged
certificate,
then such
an
attack is not possible. This
is why it is vitally important
that users under-
stand
that ignoring warnings about
expired or improper certificates
is very
dangerous,
especially when using
wireless networks. By clicking
the "ignore"
button
when prompted by their
browser, users open
themselves up to many
potential
attacks.
SSL
is not only used for
web browsing. Insecure email
protocols such as
IMAP,
POP, and SMTP can be
secured by wrapping them in an
SSL tunnel.
Most
modern email clients support
IMAPS and POPS (secure
IMAP and
POP)
as well as SSL/TLS protected
SMTP. If your email server
does not
provide
SSL support, you can
still secure it with SSL
using a package like
Stunnel
(http://www.stunnel.org/). SSL
can be used to effectively
secure just
about
any service that runs
over TCP.
SSH
Most
people think of SSH as a
secure replacement for
telnet,
just as scp
and
sftp are
the secure counterparts of
rcp
and
ftp. But
SSH is much
more
than encrypted remote shell.
Like SSL, it uses strong
public key cryp-
tography
to verify the remote server
and encrypt data. Instead of
a PKI, it
uses
a key fingerprint
cache that is checked before
a connection is permitted.
It
can use passwords, public
keys, or other methods for
user authentication.
Many
people do not know that
SSH can also act as a
general purpose en-
crypting
tunnel, or even an encrypting
web proxy. By first
establishing an
Chapter
6: Security & Monitoring
171
SSH
connection to a trusted location
near (or even on) a
remote server, in-
secure
protocols can be protected
from eavesdropping and
attack.
While
this technique may be a bit
advanced for many users,
network archi-
tects
can use SSH to encrypt
traffic across
untrusted links, such as
wireless
point-to-point
links. Since the tools
are freely available and
run over stan-
dard
TCP, any educated user
can implement SSH
connections for them-
selves,
providing their own
end-to-end encryption without
administrator inter-
vention.
OpenSSH
(http://openssh.org/) is probably
the most popular
implementation
on
Unix-like platforms. Free implementations
such as Putty
(http://www.putty.nl/) and
WinSCP (http://winscp.net/) are
available for
Windows.
OpenSSH will also run on
Windows under the Cygwin
package
(http://www.cygwin.com/). These
examples will assume that
you are using
a
recent version of
OpenSSH.
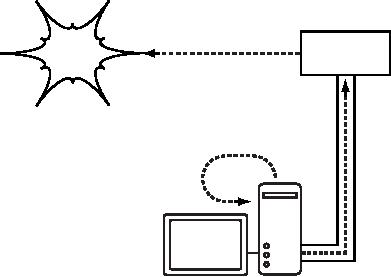
Internet
SSH
Server
All
traffic sent from
SSH
server is
unencrypted
All
web traffic is
SSH
listens for a TCP
encrypted
by SSH
connection
on localhost
port
3128
Web
browser uses
localhost
port 3128
for
its proxy
Figure
6.6: The SSH tunnel
protects web traffic up to
the SSH server
itself.
To
establish an encrypted tunnel
from a port on the local
machine to a port
on
the remote side, use
the -L
switch.
For example, suppose you
want to
forward
web proxy traffic over an
encrypted link to the squid
server at
squid.example.net.
Forward port 3128 (the
default proxy port) using
this
command:
ssh
-fN -g -L3128:squid.example.net:3128
squid.example.net
172
Chapter
6: Security & Monitoring
The
-fN
switches
instruct ssh to fork into
the background after
connecting.
The
-g switch
allows other users on your
local segment to connect to
the lo-
cal
machine and use it for
encryption over the
untrusted link. OpenSSH
will
use
a public key for
authentication if you have
set one up, or it will
prompt
you
for your password on the
remote side. You can
then configure
your web
browser
to connect to localhost port
3128 as its web proxy
service. All web
traffic
will then be encrypted
before transmission to the
remote side.
SSH
can also act as a dynamic
SOCKS4 or SOCKS5 proxy. This
allows you
to
create an encrypting web
proxy, without the need to
set up squid. Note
that
this is not a caching proxy;
it simply encrypts all
traffic.
ssh
-fN -D 8080 remote.example.net
Configure
your web browser to use
SOCKS4 or SOCKS5 on local
port 8080,
and
away you go.
SSH
can encrypt data on any
TCP port, including ports
used for email. It
can
even
compress the data along
the way, which can
decrease latency on
low
capacity
links.
ssh
-fNCg -L110:localhost:110 -L25:localhost:25
mailhost.example.net
The
-C switch
turns on compression. You
can add as many port
forwarding
rules
as you like by specifying
the -L
switch
multiple times. Note that in
order
to
bind to a local port less
than 1024, you must
have root privileges on
the
local
machine.
These
are just a few examples of
the flexibility of
SSH. By implementing
public
keys and using the
ssh forwarding agent, you
can automate the
crea-
tion
of encrypted tunnels throughout
your wireless network, and
protect your
communications
with strong encryption and
authentication.
OpenVPN
OpenVPN
is a free, open source VPN
implementation built on SSL
encryp-
tion.
There are OpenVPN client
implementations for a wide
range of operat-
ing
systems, including Linux,
Windows 2000/XP and higher,
OpenBSD,
FreeBSD,
NetBSD, Mac OS X, and
Solaris. Being a VPN, it
encapsulates all
traffic
(including DNS and all
other protocols) in an encrypted
tunnel, not just
a
single TCP port. Most
people find it
considerably easier to understand
and
configure
than IPSEC.
OpenVPN
also has some disadvantages,
such as fairly high latency.
Some
amount
of latency is unavoidable since
all encryption/decryption is done
in
user
space, but using relatively
new computers on either end
of the tunnel
can
minimize this. While it
can use traditional shared
keys, OpenVPN
Chapter
6: Security & Monitoring
173
really
shines when used with
SSL certificates and a
certificate authority.
OpenVPN
has many advantages that
make it a good option for
providing
end-to-end
security.
Some
of these reasons
include:
�
It is based on a proven, robust
encryption protocol (SSL and
RSA)
�
It is relatively easy to configure
�
It functions across many
different platforms
�
It is well documented
�
It's free and open
source.
OpenVPN
needs to connect to a single
TCP or UDP port on the
remote side.
Once
established, it can encapsulate
all data down to the
Networking layer,
or
even down to the Data-Link
layer, if your solution
requires it. You can
use it
to
create robust VPN
connections between individual
machines, or simply
use
it to connect network routers
over untrusted wireless
networks.
VPN
technology is a complex field,
and is a bit beyond the
scope of this
section
to go into more detail. It is
important to understand how
VPNs fit
into
the structure of your
network in order to provide
the best possible
pro-
tection
without opening up your
organization to unintentional
problems.
There
are many good online
resources that deal with
installing OpenVPN
on
a server and client, we
recommend this article from
Linux Journal:
http://www.linuxjournal.com/article/7949
as well as
the official HOWTO:
http://openvpn.net/howto.html
Tor
& Anonymizers
The
Internet is basically an open
network based on trust. When
you connect
to
a web server across the
Internet, your traffic passes
through many differ-
ent
routers, owned by a great
variety of institutions, corporations
and indi-
viduals.
In principle, any one of
these routers has the
ability to look closely
at
your
data, seeing the source
and destination addresses,
and quite often
also
the
actual content of the data.
Even if your data is
encrypted using a
secure
protocol,
it is possible for your
Internet provider to monitor
the amount of data
transferred,
as well as the source and
destination of that data.
Often this is
enough
to piece together a fairly
complete picture of your
activities on-line.
Privacy
and anonymity are important,
and closely linked to each
other. There
are
many valid reasons to
consider protecting your
privacy by anonymizing
your
network traffic. Suppose
you want to offer Internet
connectivity to your
local
community by setting up a number of
access points for people to
con-
nect
to. Whether you charge
them for their access or
not, there is always
the
174
Chapter
6: Security & Monitoring
risk
that people use the
network for something that
is not legal in your
coun-
try
or region. You could plead
with the legal system
that this particular
illegal
action
was not performed by
yourself, but could have
been performed by
anyone
connecting to your network.
The problem is neatly
sidestepped if it
were
technically infeasible to determine
where your traffic was
actually
headed.
And what about on-line
censorship? Publishing web
pages anony-
mously
may also be necessary to
avoid government
censorship.
There
are tools that allow
you to anonymize your
traffic in
relatively easy
ways.
The combination of Tor
(http://www.torproject.org/) and
Privoxy
(http://www.privoxy.org/) is a
powerful way to run a local
proxy server that
will
pass your Internet
traffic through a
number of servers all across
the net,
making
it very difficult to
follow the trail of
information. Tor can be run
on a
local
PC, under Microsoft Windows,
Mac OSX, Linux and a
variety of BSD's,
where
it anonymizes traffic from
the browser on that
particular machine.
Tor
and
Privoxy can also be
installed on a gateway server, or
even a small em-
bedded
access point (such as a
Linksys WRT54G) where they
provides ano-
nymity
to all network users
automatically.
Tor
works by repeatedly bouncing
your TCP connections across
a number of
servers
spread throughout the
Internet, and by wrapping
routing information
in
a number of encrypted layers
(hence the term
onion
routing), that
get
peeled
off as the packet moves
across the network. This
means that, at any
given
point in the network, the
source and destination
addresses cannot be
linked
together. This makes
traffic analysis
extremely difficult.
The
need for the Privoxy
privacy proxy in connection
with Tor is due to
the
fact
that name server queries
(DNS queries) in most cases
are not passed
through
the proxy server, and
someone analyzing your
traffic would
easily be
able
to see that you were
trying to reach a specific site
(say google.com) by
the
fact that you sent a
DNS query to translate
google.com to the
appropriate
IP
address. Privoxy connects to
Tor as a SOCKS4a proxy,
which uses host-
names
(not IP addresses) to get
your packets to the intended
destination.
In
other words, using Privoxy
with Tor is a simple and
effective way to pre-
vent
traffic analysis
from linking your IP address
with the services you
use
online.
Combined with secure,
encrypted protocols (such as
those we have
seen
in this chapter), Tor and
Privoxy provide a high level
of anonymity on
the
Internet.
Network
Monitoring
Network
monitoring is the use of
logging and analysis tools
to accurately de-
termine
traffic flows,
utilization, and other
performance indicators on a
net-
work.
Good monitoring tools give
you both hard numbers
and graphical ag-
Chapter
6: Security & Monitoring
175
gregate
representations of the state of
the network. This helps
you to visu-
alize
precisely what is happening, so
you know where adjustments
may be
needed.
These tools can help
you answer critical
questions, such as:
�
What are the most
popular services used on the
network?
�
Who are the heaviest
network users?
�
What other wireless channels
are in use in my
area?
�
Are users installing
wireless access points on my
private wired
network?
�
At what time of the day is
the network most
utilized?
�
What sites do your users
frequent?
�
Is the amount of inbound or
outbound traffic close to
our available network
capacity?
�
Are there indications of an
unusual network situation
that is consuming
bandwidth
or causing other
problems?
�
Is our Internet Service
Provider (ISP) providing the
level of service that
we
are
paying for? This should be
answered in terms of available
bandwidth,
packet
loss, latency, and overall
availability.
And
perhaps the most important
question of all:
�
Do the observed traffic patterns
fit our
expectations?
Let's
look at how a typical system
administrator can make good
use of net-
work
monitoring tools.
An
effective network monitoring
example
For
the purposes of example,
let's assume that we are in
charge of a network
that
has been running for
three months. It consists of 50
computers and three
servers:
email, web, and proxy
servers. While initially
things are going
well,
users
begin to complain of slow
network speeds and an
increase in spam
emails.
As time goes on,
computer performance slows to a
crawl (even
when
not using the network),
causing considerable frustration in
your users.
With
frequent complaints and very
low computer usage, the
Board is ques-
tioning
the need for so much
network hardware. The Board
also wants evi-
dence
that the bandwidth they
are paying for is actually
being used. As the
network
administrator, you are on
the receiving end of these
complaints. How
can
you diagnose the sudden
drop in network and computer
performance
and
also justify the network
hardware and bandwidth
costs?
176
Chapter
6: Security & Monitoring
Monitoring
the LAN (local
traffic)
To
get an idea of exactly what
is causing the slow down,
you should begin by
looking
at traffic on the
local LAN. There are
several advantages to
monitor-
ing
local traffic:
�
Troubleshooting is greatly
simplified.
�
Viruses can be detected and
eliminated.
�
Malicious users can be
detected and dealt
with.
�
Network hardware and
resources can be justified with
real statistics.
Assume
that all of the switches
support the Simple
Network Management
Protocol
(SNMP). SNMP is an
application-layer protocol designed to
facili-
tate
the exchange of management
information between network
devices. By
assigning
an IP address to each switch,
you are able to monitor
all the inter-
faces
on that switch, observing
the entire network from a
single point. This is
much
easier than enabling SNMP on
all computers in a
network.
By
using a free tool such as
MRTG (see Page
190), you
can monitor each
port
on the switch and present
data graphically, as an aggregate
average
over
time. The graphs are
accessible from the web, so
you are able to
view
the
graphs from any machine at
anytime.
With
MRTG monitoring in place, it
becomes obvious that the
internal LAN is
swamped
with far more
traffic than
the Internet connection can
support, even
when
the lab is unoccupied. This
is a pretty clear indication
that some of the
computers
are infested with a network
virus. After installing good
anti-virus
and
anti-spyware software on all of
the machines, the internal
LAN traffic
settles
down to expected levels.
The machines run much
more quickly,
spam
emails are reduced, and
the users' morale quickly
improves.
Monitoring
the WAN (external
traffic)
In
addition to watching the
traffic on the
internal LAN, you need to
demon-
strate
that the bandwidth the
organization is paying for is
actually what they
are
getting from their ISP.
You can achieve this by
monitoring external
traf-
fic.
External
traffic is generally
classified as anything
sent over a Wide
Area
Network
(WAN). Anything
received from (or sent
to) a network other
than
your
internal LAN also
qualifies as external
traffic. The
advantages of moni-
toring
external traffic
include:
�
Internet bandwidth costs are
justified by showing
actual usage, and
whether
that usage agrees with
your ISP's bandwidth
charges.
Chapter
6: Security & Monitoring
177
�
Future capacity needs are
estimated by watching usage
trends and pre-
dicting
likely growth
patterns.
�
Intruders from the Internet
are detected and filtered
before they can
cause
problems.
Monitoring
this traffic is easily
done with the use of
MRTG on an SNMP en-
abled
device, such as a router. If
your router does not
support SNMP, then
you
can add a switch between
your router and your
ISP connection, and
monitor
the port traffic just as
you would with an internal
LAN.
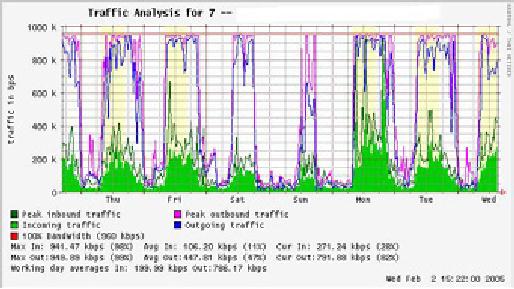
Detecting
Network Outages
With
monitoring tools in place,
you now have an accurate
measurement of
how
much bandwidth the
organization is using. This
measurement should
agree
with your ISP's bandwidth
charges. It can also
indicate the actual
throughput
of your connection if you
are using close to your
available capac-
ity
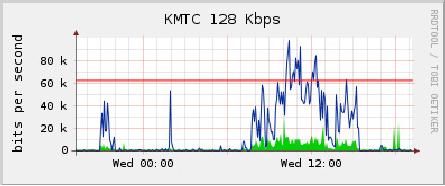
at peak times. A "flat top"
graph is a fairly clear
indication that you
are
operating
at full capacity. Figure
6.7 shows
flat tops in
peak outbound traffic
in
the middle of every day
except Sunday.
It
is clear that your current
Internet connection is overutilized at
peak times,
causing
network lag. After
presenting this information to
the Board, you
can
make
a plan for further
optimizing your existing
connection (by
upgrading
your
proxy server and using
other techniques in this
book) and estimate
how
soon
you will need to upgrade
your connection to keep up
with the demand.
This
is also an excellent time to
review your operational
policy with the
Board,
and discuss ways to bring
actual usage in line with
that policy.
Figure
6.7: A graph with a "flat
top" is one indication of
overutilization.
178
Chapter
6: Security & Monitoring
Later
in the week, you receive an
emergency phone call in the
evening.
Apparently,
no one in the lab can
browse the web or send
email. You rush to
the
lab and hastily reboot
the proxy server, with no
results. Browsing and
email
are still broken. You
then reboot the router,
but there is still no
success.
You
continue eliminating the
possible fault areas one by
one until you
realize
that
the network switch is off -
a loose power cable is to
blame. After applying
power,
the network comes to life
again.
How
can you troubleshoot such an
outage without such time
consuming trial
and
error? Is it possible to be
notified of outages
as they occur, rather
than
waiting
for a user to complain? One
way to do this is to use a
program such
as
Nagios
that
continually polls network
devices and notifies you of
outages.
Nagios
will report on the
availability of various machines
and services, and
will
alert you to machines that
have gone down. In addition
to displaying the
network
status graphically on a web
page, it will send
notifications
via SMS
or
email, alerting you
immediately when problems
arise.
With
good monitoring tools in
place, you will be able to
justify the cost of
equipment
and bandwidth by effectively
demonstrating how it is being
used
by
the organization. You are
notified
automatically when problems
arise, and
you
have historical statistics of
how the network devices
are performing. You
can
check the current
performance against this
history to find unusual
behav-
ior,
and head off problems
before they become critical.
When problems do
come
up, it is simple to determine
the source and nature of
the problem.
Your
job is easier, the Board is
satisfied,
and your users are
much happier.
Monitoring
your network
Managing
a network without monitoring is
similar to driving a vehicle
without
a
speedometer or a fuel gauge,
with your eyes closed.
How do you know
how
fast you are going? Is
the car consuming fuel as
efficiently
as promised
by
the dealers? If you do an
engine overhaul several
months later, is the
car
any
faster or more efficient
than it was before?
Similarly,
how can you pay
for an electricity or water
bill without seeing
your
monthly
usage from a meter? You
must have an account of your
network
bandwidth
utilization in order to justify
the cost of services and
hardware pur-
chases,
and to account for usage
trends.
There
are several benefits to
implementing a good monitoring
system for
your
network:
1.
Network
budget and resources are
justified.
Good
monitoring tools
can
demonstrate without a doubt
that the network
infrastructure (band-
width,
hardware, and software) is
suitable and able to handle
the re-
quirements
of network users.
Chapter
6: Security & Monitoring
179
2.
Network
intruders are detected and filtered.
By
watching your net-
work
traffic, you
can detect attackers and
prevent access to critical
inter-
nal
servers and services.
3.
Network
viruses are easily detected.
You
can be alerted to the
pres-
ence
of network viruses, and take
appropriate action before
they con-
sume
Internet bandwidth and
destabilize your
network
4.
Troubleshooting
of network problems is greatly
simplified.
Rather
than
attempting "trial and error"
to debug network problems,
you can be
instantly
notified of
specific problems.
Some kinds of problems can
even
be
repaired automatically.
5.
Network
performance can be highly optimized.
Without
effective
monitoring,
it is impossible to fine tune
your devices and protocols
to
achieve
the best possible
performance.
6.
Capacity
planning is much easier. With
solid historical
performance
records,
you do not have to "guess"
how much bandwidth you
will need
as
your network grows.
7.
Proper network usage
can be enforced. When
bandwidth is a scarce
resource,
the only way to be fair to
all users is to ensure that
the network
is
being used for its
intended purpose.
Fortunately,
network monitoring does not
need to be an expensive
undertak-
ing.
There are many freely
available open source tools
that will show
you
exactly
what is happening on your
network in considerable detail.
This sec-
tion
will help you identify
many invaluable tools and
how best to use
them.
The
dedicated monitoring
server
While
monitoring services can be
added to an existing network
server, it is of-
ten
desirable to dedicate one
machine (or more, if necessary) to
network moni-
toring.
Some applications (such as
ntop) require
considerable resources to
run,
particularly on a busy network.
But most logging and
monitoring programs
have
modest RAM and storage
requirements, typically with
little CPU power
required.
Since open source operating
systems (such as Linux or
BSD) make
very
efficient use of hardware
resources, this makes it
possible to build a
very
capable
monitoring server from
recycled PC parts. There is
usually no need
to
purchase a brand new server
to relegate to monitoring
duties.
The
exception to this rule is in
very large installations. If
your network in-
cludes
more than a few hundred
nodes, or if you consume
more than
50
Mbps of
Internet bandwidth, you will
likely need to split up
monitoring du-
ties
between a few dedicated
machines. This depends
largely on exactly
what
you want to monitor. If you
are attempting to account
for all services
accessed
per MAC address, this
will consume considerably
more resources
180
Chapter
6: Security & Monitoring
than
simply measuring network flows
on a switch port. But for
the majority of
installations,
a single dedicated monitoring
machine is usually
enough.
While
consolidating monitoring services to a
single machine will
streamline
administration
and upgrades, it can also
ensure better ongoing
monitoring.
For
example, if you install
monitoring services on a web
server, and that
web
server
develops problems, then your
network may not be monitored
until the
problem
is resolved.
To
a network administrator, the
data collected about network
performance is
nearly
as important as the network
itself. Your monitoring
should be robust
and
protected from service
outages as well as possible.
Without network
statistics,
you are effectively blind to
problems with the
network.
Where
does the server fit in my
network?
If
you are only interested in
collecting network flow
statistics from a
router,
you
can do this from just
about anywhere on the LAN.
This provides simple
feedback
about utilization, but
cannot give you
comprehensive details
about
usage patterns. Figure
6.8 shows a
typical MRTG graph
generated
from
the Internet router.
While the inbound and
outbound utilization
are
clear,
there is no detail about
which computers, users, or
protocols are us-
ing
bandwidth.
Figure
6.8: Polling the edge
router can show you
the overall network
utilization, but
you
cannot break the data down
further into machines,
services, and
users.
For
more detail, the dedicated
monitoring server must have
access to eve-
rything
that needs to be watched.
Typically, this means it
must have ac-
cess
to the entire network. To
monitor a WAN connection, such as
the
Internet
link to your ISP, the
monitoring server must be
able to see the
traf-
fic
passing through the edge
router. To monitor a LAN,
the monitoring
server
is typically connected to a
monitor
port on the
switch. If multiple
switches
are used in an installation,
the monitoring server may
need a con-
nection
to all of them. That
connection can either be a
physical cable, or if
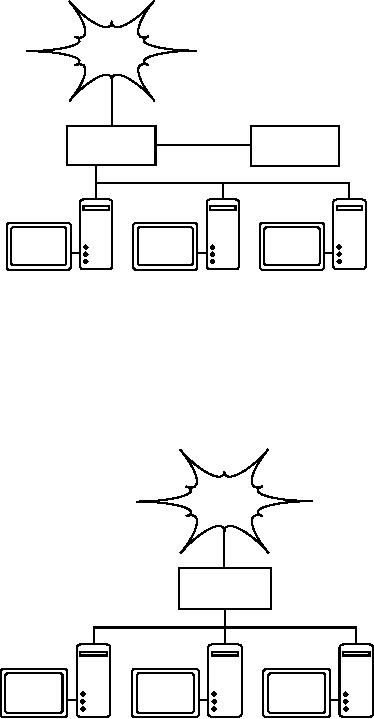
Chapter
6: Security & Monitoring
181
your
network switches support it,
a VLAN specifically configured
for moni-
toring
traffic.
Internet
Monitor
port
Network
Switch
monitor
Figure
6.9: Use the monitor
port on your switch to
observe traffic
crossing all of the
network
ports.
If
monitor port functionality is
not available on your
switch, the
monitoring
server
may be installed between
your internal LAN and
the Internet. While
this
will work, it introduces a
single point of failure for
the network, as the
network
will fail if the monitoring
server develops a problem. It is
also a po-
tential
performance bottleneck, if the
server cannot keep up with
the de-
mands
of the network.
Internet
Network
monitor
Figure
6.10: By inserting a network
monitor between the LAN
and your Internet
con-
nection,
you can observe all network
traffic.
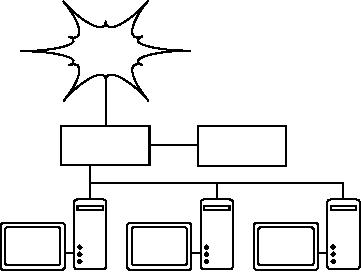
182
Chapter
6: Security & Monitoring
A
better solution is to use a
simple network hub (not a
switch) which con-
nects
the monitoring machine to
the internal LAN, external
router, and the
monitoring
machine. While this does
still introduce an additional
point of fail-
ure
to the network (since the
entire network will be
unreachable if the
hub
dies),
hubs are generally
considered to be much more
reliable than
routers.
They
are also very easily
replaced should they
fail.
Internet
Network
Hub
monitor
Figure
6.11: If your switch does
not provide monitor port
functionality, you can
insert
a
network hub between your
Internet router and the
LAN, and connect the
monitoring
server
to the hub.
Once
your monitoring server is in
place, you are ready to
start collecting
data.
What
to monitor
It
is possible to plot just
about any network event
and watch its value on
a
graph
over time. Since every
network is slightly different,
you will have to
decide
what information is important in
order to gauge the
performance of
your
network.
Here
are some important
indicators that many network
administrators will
typically
track.
Wireless
statistics
�
Received signal and noise
from all backbone
nodes
�
Number of associated
stations
�
Detected adjacent networks
and channels
�
Excessive retransmissions
Chapter
6: Security & Monitoring
183
�
Radio data rate, if using
automatic rate
scaling
Switch
statistics
�
Bandwidth usage per switch
port
�
Bandwidth usage broken down
by protocol
�
Bandwidth usage broken down
by MAC address
�
Broadcasts as a percentage of total
packets
�
Packet loss and error
rate
Internet
statistics
�
Internet bandwidth use by
host and protocol
�
Proxy server cache
hits
�
Top 100 sites
accessed
�
DNS requests
�
Number of inbound emails /
spam emails / email
bounces
�
Outbound email queue
size
�
Availability of critical services
(web servers, email servers,
etc.).
�
Ping times and packet
loss rates to your
ISP
�
Status of backups
System
health statistics
�
Memory usage
�
Swap file
usage
�
Process count / zombie
processes
�
System load
�
Uninterruptible Power Supply
(UPS) voltage and
load
�
Temperature, fan speed, and
system voltages
�
Disk SMART status
�
RAID array status
You
should use this list as a
suggestion of where to begin. As
your network
matures,
you will likely find new
key indicators of network
performance, and
you
should of course track those
as well. There are many
freely available
184
Chapter
6: Security & Monitoring
tools
that will show you as
much detail as you like
about what is
happening
on
your network. You should
consider monitoring the
availability of any
re-
source
where unavailability would
adversely affect your
network users.
For
example, your users may
dial into modems on your
site to gain remote
access
to your network. If all the
modems are used, or if any
are faulty, then
users
will be denied access and
will probably complain. You
can predict and
avoid
such problems by monitoring
the number of available
modems, and
provisioning
extra capacity before you
run out.
Don't
forget to monitor the
monitoring machine itself,
for example its
CPU
usage
and disk space, in order to
receive advance warning if it
becomes
overloaded
or faulty. A monitoring machine
that is low on resources can
af-
fect
your ability to monitor the
network effectively.
Types
of monitoring tools
We
will now look at several
different classes of monitoring
tools. Network
detection
tools
listen for the beacons
sent by wireless access
points, and
display
information such as the
network name, received
signal strength, and
channel.
Spot
check tools
are designed for
troubleshooting and normally
run
interactively
for short periods of time. A
program such as ping
may
be con-
sidered
an active spot check tool,
since it generates traffic by polling a
par-
ticular
machine. Passive spot check
tools include protocol
analyzers,
which
inspect
every packet on the network
and provide complete detail
about any
network
conversation (including source
and destination addresses,
protocol
information,
and even application data).
Trending
tools
perform unattended
monitoring
over long periods, and
typically plot the results
on a graph. Real-
time
monitoring tools
perform similar monitoring,
but notify
administrators
immediately
if they detect a problem.
Throughput
testing tools
tell you the
actual
bandwidth available between
two points on a network.
Intrusion
de-
tection
tools
watch for undesirable or
unexpected network traffic, and
take
appropriate
action (typically denying
access and/or notifying a
network ad-
ministrator).
Finally, benchmarking
tools
estimate the maximum
perform-
ance
of a service or network
connection.
Network
detection
The
simplest wireless monitoring
tools simply provide a list
of available net-
works,
along with basic information
(such as signal strength and
channel).
They
let you quickly detect
nearby networks and
determine if they are
in
range
or are causing
interference.
�
The
built-in client. All
modern operating systems
provide built-in
support
for
wireless networking. This
typically includes the
ability to scan for
avail-
able
networks, allowing the user
to choose a network from a
list. While
Chapter
6: Security & Monitoring
185
virtually
all wireless devices are
guaranteed to have a simple
scanning util-
ity,
functionality can vary
widely between implementations.
These tools are
typically
only useful for
configuring a
computer in a home or office
setting.
They
tend to provide little
information apart from
network names and
the
available
signal to the access point
currently in use.
�
Netstumbler
(http://www.netstumbler.com/). This is
the most popular
tool
for
detecting wireless networks
using Microsoft Windows. It
supports a
variety
of wireless cards, and is
very easy to use. It will
detect open and
encrypted
networks, but cannot detect
"closed" wireless networks. It
also
features
a signal/noise meter that
plots radio receiver data as
a graph over
time.
It also integrates with a
variety of GPS devices, for
logging precise
location
and signal strength
information. This makes
Netstumbler a handy
tool
to have for an informal site
survey.
�
Ministumbler
(http://www.netstumbler.com/).
From
the makers of
Netstumbler,
Ministumbler provides much of
the same functionality as
the
Windows
version, but works on the
Pocket PC platform. Ministumbler
is
handy
to run on a handheld PDA
with a wireless card for
detecting access
points
in the field.
�
Macstumbler
(http://www.macstumbler.com/). While
not directly related
to
the Netstumbler, Macstumbler
provides much of the same
functionality
but
for the Mac OS X platform.
It works with all Apple
Airport cards.
�
Wellenreiter
(http://www.wellenreiter.net/).
Wellenreiter is a nice
graphi-
cal
wireless network detector
for Linux. It requires Perl
and GTK, and
sup-
ports
Prism2, Lucent, and Cisco
wireless cards.
Spot
check tools
What
do you do when the network
breaks? If you can t
access a
web page
or
email server, and clicking
the reload button doesn
t fix
the problem, then
you
ll need to be
able to isolate the exact
location of the problem.
These
tools
will help you to determine
just where a connection
problem exists.
This
section is simply an introduction to
commonly used
troubleshooting
tools.
For more discussion of
common network problems and
how to diag-
nose
them, see Chapter
9, Troubleshooting.
ping
Just
about every operating system
(including Windows, Mac OS X,
and of
course
Linux and BSD) includes a
version of the ping
utility.
It uses ICMP
packets
to attempt to contact a specified
host, and tells you
how long it takes
to
get a response.
186
Chapter
6: Security & Monitoring
Knowing
what to ping is just as
important as knowing how to
ping. If you find
that
you cannot connect to a
particular service in your
web browser (say,
http://yahoo.com/), you
could try to ping
it:
$
ping
yahoo.com
PING
yahoo.com (66.94.234.13): 56 data bytes
64
bytes from 66.94.234.13: icmp_seq=0 ttl=57 time=29.375
ms
64
bytes from 66.94.234.13: icmp_seq=1 ttl=56 time=35.467
ms
64
bytes from 66.94.234.13: icmp_seq=2 ttl=56 time=34.158
ms
^C
---
yahoo.com ping statistics ---
3
packets transmitted, 3 packets received, 0% packet
loss
round-trip
min/avg/max/stddev = 29.375/33.000/35.467/2.618
ms
Hit
control-C when you are
finished
collecting data. If packets
take a long
time
to come back, there may be
network congestion. If return
ping packets
have
an unusually low Time
To Live (TTL), you
may have routing
problems
between
your machine and the
remote end. But what if
the ping doesn t
re-
turn
any data at all? If you
are pinging a name instead
of an IP address, you
may
be running into DNS
problems.
Try
pinging an IP address on the
Internet. If you can t
reach
it, it s
a
good
idea
to see if you can ping
your default router:
$
ping
69.90.235.230
PING
69.90.235.230 (69.90.235.230): 56 data bytes
64
bytes from 69.90.235.230: icmp_seq=0 ttl=126 time=12.991
ms
64
bytes from 69.90.235.230: icmp_seq=1 ttl=126 time=14.869
ms
64
bytes from 69.90.235.230: icmp_seq=2 ttl=126 time=13.897
ms
^C
---
216.231.38.1 ping statistics ---
3
packets transmitted, 3 packets received, 0% packet
loss
round-trip
min/avg/max/stddev = 12.991/13.919/14.869/0.767
ms
If
you can t
ping
your default router, then
chances are you won
t be able
to
get
to the Internet either. If
you can t
even
ping other IP addresses on
your
local
LAN, then it s
time to
check your connection. If
you re using
Ethernet,
is
it plugged in? If you re using
wireless, are you connected
to the proper
wireless
network, and is it in
range?
Network
debugging with ping is a bit
of an art, but it is useful to
learn.
Since
you will likely find ping on
just about any machine
you will work
on,
it
s a good
idea to learn how to use it
well.
traceroute
and mtr
http://www.bitwizard.nl/mtr/. As with
ping, traceroute is found on
most oper-
ating
systems (it s
called
tracert
in
some versions of Microsoft
Windows). By
running
traceroute, you can find the
location of problems between
your com-
puter
and any point on the
Internet:
Chapter
6: Security & Monitoring
187
$
traceroute -n
google.com
traceroute
to google.com (72.14.207.99), 64 hops
max, 40 byte packets
1
10.15.6.1 4.322 ms 1.763 ms 1.731 ms
2
216.231.38.1 36.187 ms 14.648 ms
13.561 ms
3
69.17.83.233 14.197 ms 13.256 ms
13.267 ms
4
69.17.83.150 32.478 ms 29.545 ms
27.494 ms
5
198.32.176.31 40.788 ms
28.160 ms 28.115 ms
6
66.249.94.14 28.601 ms 29.913 ms
28.811 ms
7
172.16.236.8 2328.809 ms 2528.944 ms
2428.719 ms
8
***
The
-n switch
tells traceroute not to
bother resolving names in
DNS, and
makes
the trace run more
quickly. You can see
that at hop seven, the
round
trip
time shoots up to more than
two seconds, while packets
seem to be dis-
carded
at hop eight. This might
indicate a problem at that
point in the net-
work.
If this part of the network
is in your control, it might be
worth starting
your
troubleshooting effort
there.
My
TraceRoute (mtr)
is a handy program that
combines ping and
traceroute
into
a single tool. By running
mtr, you can get an
ongoing average of
latency
and
packet loss to a single
host, instead of the
momentary snapshot
that
ping
and traceroute
provide.
My
traceroute [v0.69]
tesla.rob.swn
(0.0.0.0)
(tos=0x0
psize=64 bitpatSun Jan 8 20:01:26
2006
Keys:
Help
Display
mode
Restart
statistics
Order
of fields
quit
Packets
Pings
Host
Loss%
Snt
Last
Avg
Best Wrst
StDev
1.
gremlin.rob.swn
0.0%
4
1.9
2.0
1.7
2.6
0.4
2.
er1.sea1.speakeasy.net
0.0%
4
15.5
14.0 12.7 15.5
1.3
3.
220.ge-0-1-0.cr2.sea1.speakeasy.
0.0%
4
11.0
11.7 10.7 14.0
1.6
4.
fe-0-3-0.cr2.sfo1.speakeasy.net
0.0%
4
36.0
34.7 28.7 38.1
4.1
5.
bas1-m.pao.yahoo.com
0.0%
4
27.9
29.6 27.9 33.0
2.4
6.
so-1-1-0.pat1.dce.yahoo.com
0.0%
4
89.7
91.0 89.7 93.0
1.4
7.
ae1.p400.msr1.dcn.yahoo.com
0.0%
4
91.2
93.1 90.8 99.2
4.1
8.
ge5-2.bas1-m.dcn.yahoo.com
0.0%
4
89.3
91.0 89.3 93.4
1.9
9.
w2.rc.vip.dcn.yahoo.com
0.0%
3
91.2
93.1 90.8 99.2
4.1
The
data will be continuously
updated and averaged over
time. As with ping,
you
should hit control-C when
you are finished
looking at the data. Note
that
you
must have root privileges to
run mtr.
While
these tools will not
revel precisely what is
wrong with the network,
they
can
give you enough information
to know where to continue
troubleshooting.
Protocol
analyzers
Network
protocol analyzers provide a great deal of detail
about information flow-
ing
through a network, by allowing you to
inspect individual packets. For
wired
networks,
you can inspect packets at
the data-link layer or above. For
wireless
networks,
you can inspect information
all the way down to
individual 802.11
frames.
Here are several popular
(and free) network protocol
analyzers:
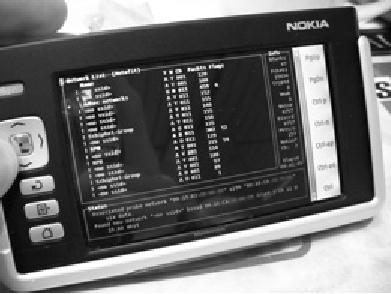
188
Chapter
6: Security & Monitoring
Kismet
http://www.kismetwireless.net/. Kismet is a
powerful wireless protocol
ana-
lyzer
for many platforms including
Linux, Mac OS X, and even
the embedded
OpenWRT
Linux distribution. It works
with any wireless card
that supports
passive
monitor mode. In addition to
basic network detection,
Kismet will
passively
log all 802.11 frames to
disk or to the network in
standard PCAP
format,
for later analysis with
tools like Ethereal. Kismet
also features associ-
ated
client information, AP hardware
fingerprinting,
Netstumbler detection,
and
GPS integration.
Since
it is a passive network monitor, it
can even detect "closed"
wireless
networks
by analyzing traffic sent by
wireless clients. You can
run Kismet on
several
machines at once, and have
them all report over
the network back to
a
central user interface. This
allows for wireless
monitoring over a large
area,
such
as a university or corporate
campus.
Figure
6.12: Kismet running on a
Nokia 770 Internet
Tablet
Since
Kismet uses the radio
card's passive monitor mode,
it does all of this
without
transmitting any data.
Kismet is an invaluable tool
for diagnosing
wireless
network problems.
KisMAC
http://kismac.macpirate.ch/. Exclusively
for the Mac OS X platform,
KisMAC
does
much of what Kismet can
do, but with a slick
Mac OS X graphical
inter-
face.
It is a passive scanner that
will log data to disk in
PCAP format com-
patible
with Wireshark. It supports
passive scanning with
AirportExtreme
cards
as well as a variety of USB
wireless adapters.
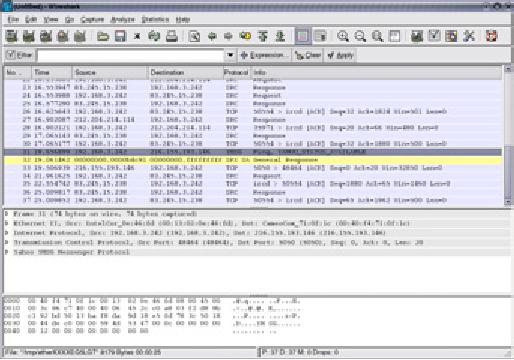
Chapter
6: Security & Monitoring
189
tcpdump
http://www.tcpdump.org/. tcpdump
is
a command-line tool for
monitoring
network
traffic. It does
not have all the
bells and whistles of
wireshark but it
does
use fewer resources. Tcpdump
can capture and display
all network pro-
tocol
information down to the link
layer. It can show all of
the packet headers
and
data received, or just the
packets that match
particular criteria.
Packets
captured
with tcpdump can be loaded
into wireshark for visual
analysis and
further
diagnostics. This is very
useful if you wish to
monitor an interface on a
remote
system and bring the
file back to
your local machine for
analysis. The
tcpdump
tool is available as a standard
tool in Unix derivatives
(Linux, BSD,
and
Mac OS X). There is also a
Windows port called
WinDump
available
at
http://www.winpcap.org/windump/.
Wireshark
http://www.wireshark.org/.
Formerly
known as Ethereal,
Wireshark is a free
network
protocol analyzer for Unix
and Windows. It is billed as
"The World's
Most
Popular Network Protocol
Analyzer."
Figure
6.13: Wireshark (formerly
Ethereal) is a powerful network
protocol analyzer
that
can
show you as much detail as
you like about any
packet.
Wireshark
allows you to examine data
from a live network or from
a capture
file
on disk, and interactively
browse and sort the
captured data. Both
summary
and detailed information is
available for each packet,
including
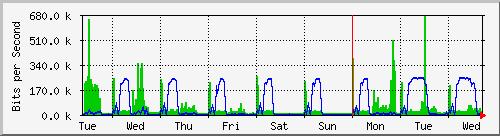
190
Chapter
6: Security & Monitoring
the
full header and data
portions. Wireshark has
several powerful
features,
including
a rich display filter
language and the ability to
view the recon-
structed
stream of a TCP
session.
It
can be daunting to use for
first
time users or those that
are not familiar
with
the
OSI layers. It is typically
used to isolate and analyze
specific
traffic to or
from
an IP address, but it can be
also used as a general
purpose fault finding
tool.
For example, a machine
infected with a network worm
or virus can be
identified
by looking for the machine
that is send out the
same sort of TCPIP
packets
to large groups of IP
addresses.
Trending
tools
Trending
tools are used to see
how your network is used
over a long period
of
time. They work by
periodically monitoring your
network activity, and
dis-
playing
a summary in a human-readable form
(such as a graph).
Trending
tools
collect data as well as
analyze and report on
it.
Below
are some examples of
trending tools. Some of them
need to be used
in
conjunction with each other,
as they are not stand-alone
programs.
MRTG
http://oss.oetiker.ch/mrtg/.
The
Multi
Router Traffic
Grapher (MRTG)
monitors
the traffic load on
network links using SNMP.
MRTG generates
graphs
that provide a visual
representation of inbound and
outbound traffic.
These
are typically displayed on a
web page.
MRTG
can be a little confusing to
set up, especially if you
are not familiar
with
SNMP. But once it is
installed, MRTG requires
virtually no maintenance,
unless
you change something on the
system that is being
monitored (such as
its
IP address).
Figure
6.14: MRTG is probably the
most widely installed
network flow
grapher.
RRDtool
http://oss.oetiker.ch/rrdtool/.
RRD
is short
for Round
Robin Database.
RRD
is
a database that stores
information in a very compact
way that does
not
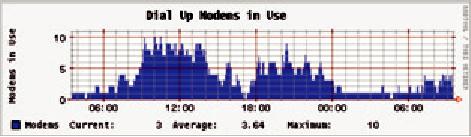
Chapter
6: Security & Monitoring
191
expand
over time. RRDtool
refers to a
suite of tools that allow
you to create
and
modify RRD databases, as
well as generate useful
graphs to present the
data.
It is used to keep track of
time-series data (such as
network band-
width,
machine room temperature, or
server load average) and
can display
that
data as an average over
time.
Note
that RRDtool itself does
not contact network devices
to retrieve data. It is
merely
a database manipulation tool.
You can use a simple
wrapper script
(typically
in shell or Perl) to do that
work for you. RRDtool is
also used by
many
full featured front-ends
that present you with a
friendly web interface
for
configuration
and display. RRD graphs
give you more control
over display op-
tions
and the number of items
available on a graph as compared to
MRTG.
Figure
6.15: RRDtool gives you a
lot of flexibility
in how your collected
network data
may
be displayed.
RRDtool
is included in virtually all
modern Linux distributions,
and can be
downloaded
from http://oss.oetiker.ch/rrdtool/.
ntop
http://www.ntop.org/. For
historical traffic analysis
and usage, you will
cer-
tainly
want to investigate ntop.
This program builds a
detailed real-time
re-
port
on observed network traffic,
displayed in your web
browser. It integrates
with
rrdtool, and makes graphs
and charts visually
depicting how the
network
is
being used. On very busy
networks, ntop can use a
lot of CPU and
disk
space,
but it gives you extensive
insight into how your
network is being
used.
It
runs on Linux, BSD, Mac OS
X, and Windows.
Some
of its more useful features
include:
�
Traffic display
can be sorted by various
criteria (source, destination,
proto-
col,
MAC address, etc.).
�
Traffic statistics
grouped by protocol and port
number
�
An IP traffic matrix
which shows connections
between machines
�
Network flows
for routers or switches that
support the NetFlow
protocol
�
Host operating system
identification
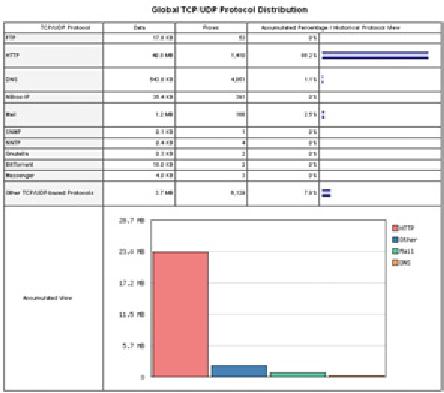
192
Chapter
6: Security & Monitoring
�
P2P traffic
identification
�
Numerous graphical
charts
�
Perl, PHP, and Python
API
Ntop
is available from http://www.ntop.org/
and is
available for most
operat-
ing
systems. It is often included in
many of the popular Linux
distributions,
including
RedHat, Debian, and Ubuntu.
While it can be left running
to collect
historical
data, ntop can be fairly
CPU intensive, depending on
the amount of
traffic
observed. If you are going
to run it for long periods
you should monitor
the
CPU utilization of the
monitoring machine.
Figure
6.16: ntop displays a wealth
of information about how
your network is
utilized
by various clients and
servers.
The
main disadvantage of ntop is
that it does not provide
instantaneous in-
formation,
only long-term totals and
averages. This can make it
difficult
to
use
to diagnose a problem that
starts suddenly.
Cacti
http://www.cacti.net/.
Cacti
is a front-end
for RRDtool. It stores all
of the
necessary
information to create graphs in a
MySQL database. The
front-end
is
written in PHP. Cacti does
the work of maintaining
graphs, data sources,
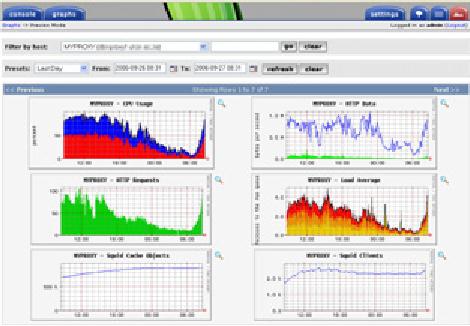
Chapter
6: Security & Monitoring
193
and
handles the actual data
gathering. There is support
for SNMP devices,
and
custom scripts can easily be
written to poll virtually
any conceivable net-
work
event.
Figure
6.17: Cacti can manage
the polling of your network
devices, and can
build
very
complex and informative
visualizations of network
behavior.
Cacti
can be somewhat confusing to
configure,
but once you work
through
the
documentation and examples, it
can yield very impressive
graphs. There
are
hundreds of templates for
various systems available on
the cacti website,
and
the code is under rapid
development.
NetFlow
NetFlow
is a protocol for collecting IP
traffic information
invented by Cisco.
From
the Cisco website:
Cisco
IOS NetFlow efficiently
provides a key set of
services for IP
appli-
cations,
including network traffic
accounting, usage-based network
bill-
ing,
network planning, security,
Denial of Service monitoring
capabilities,
and
network monitoring. NetFlow
provides valuable information
about
network
users and applications, peak
usage times, and
traffic
routing.
Cisco
routers can generate NetFlow
information which is available
from the
router
in the form of UDP packets.
NetFlow is also less
CPU-intensive on
Cisco
routers than using SNMP. It
also provides more granular
information
than
SNMP, letting you get a
more detailed picture of
port and protocol
usage.
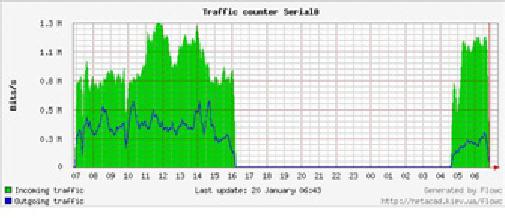
194
Chapter
6: Security & Monitoring
This
information is collected by a NetFlow
collector that stores and
presents
the
data as an aggregate over
time. By analyzing flow data,
one can build a
picture
of traffic flow and
traffic volume in a
network or on a connection.
There
are several commercial and
free NetFlow collectors
available. Ntop is
one
free tool that can
act as a NetFlow collector
and probe. Another is
Flowc
(see
below).
It
can also be desirable to use
Netflow as a spot
check tool, by just looking
at
a
quick snapshot of data
during a network crisis.
Think of NetFlow as an
al-
ternative
to SNMP for Cisco devices.
For more information about
NetFlow,
see
http://en.wikipedia.org/wiki/Netflow
.
Flowc
http://netacad.kiev.ua/flowc/. Flowc
is
an open source NetFlow
collector
(see
NetFlow above). It is lightweight
and easy to configure.
Flowc uses a
MySQL
database to store aggregated
traffic information.
Therefore, it is pos-
sible
to generate your own reports
from the data using
SQL, or use the
in-
cluded
report generators. The
built-in report generators
produce reports in
HTML,
plain text or a graphical
format.
Figure
6.18: A typical flow
chart generated by
Flowc.
The
large gap in data probably
indicates a network outage.
Trending tools
typically
will not notify you of
outages, but merely log
the occurrence. To be
notified
when network problems occur,
use a realtime monitoring
tool such as
Nagios
(see Page
200).
SmokePing
http://oss.oetiker.ch/smokeping/.
SmokePing
is a deluxe
latency measure-
ment
tool written in Perl. It can
measure, store and display
latency, latency
distribution
and packet loss all on a
single graph. SmokePing uses
RRDtool
for
data storage, and can
draw very informative graphs
that present up to
the
minute
information on the state of
your network
connection.
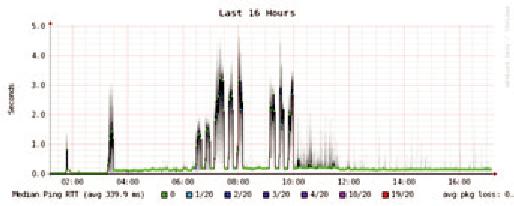
Chapter
6: Security & Monitoring
195
It
is very useful to run
SmokePing on a host with
good connectivity to your
en-
tire
network. Over time, trends
are revealed that can
point to all sorts of
net-
work
problems. Combined with MRTG
(see Page
190) or Cacti
(see Page
192),
you can observe the
effect that network
congestion has on packet
loss
and
latency. SmokePing can
optionally send alerts when
certain conditions
are
met, such as when excessive
packet loss is seen on a
link for an extended
period
of time. An example of SmokePing in
action is shown in Figure
6.19.
Figure
6.19: SmokePing can
simultaneously display packet
loss and latency
spreads
in
a single graph.
EtherApe
http://etherape.sourceforge.net/. EtherApe
displays
a graphical representa-
tion
of network traffic. Hosts
and links change size
depending on the
amount
of
traffic sent
and received. The
colors change to represent
the protocol
most
used. As with wireshark and
tcpdump, data can be
captured "off the
wire"
from a live network
connection or read from a
tcpdump capture file.
EtherApe
doesn't show quite as much
detail as ntop, but its
resource re-
quirements
are much lighter.
iptraf
http://iptraf.seul.org/.
IPTraf
is
a lightweight but powerful
LAN monitor. It
has
an ncurses interface and
runs in a command shell.
IPTraf takes a mo-
ment
to measure observed traffic,
and then displays various
network statis-
tics
including TCP and UDP
connections, ICMP and OSPF
information, traf-
fic
flows, IP checksum errors,
and more. It is a simple to
use program that
uses
minimal system
resources.
While
it does not keep historical
data, it is very useful for
displaying an in-
stantaneous
usage report.
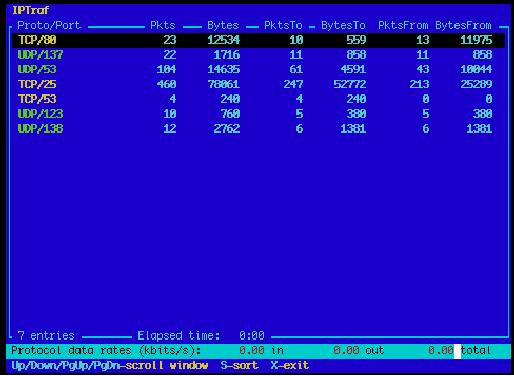
196
Chapter
6: Security & Monitoring
Figure
6.20: iptraf's statistical
breakdown of traffic by
port.
Argus
http://qosient.com/argus/.
Argus
stands
for Audit
Record Generation
and
Utilization
System. Argus is
also the name of the
mythological Greek
god
who
had hundreds of eyes.
From
the Argus website:
Argus
generates flow
statistics such as connectivity,
capacity, demand,
loss,
delay, and jitter on a per
transaction basis. Argus can
be used to
analyze
and report on the contents
of packet capture files
or it can run as
a
continuous monitor, examining
data from a live interface;
generating an
audit
log of all the network
activity seen in the packet
stream. Argus can
be
deployed to monitor individual
end-systems, or an entire
enterprises
network
activity. As a continuous monitor,
Argus provides both push
and
pull
data handling models, to
allow flexible
strategies for collecting
net-
work
audit data. Argus data
clients support a range of
operations, such
as
sorting, aggregation, archival
and reporting.
Argus
consists of two parts: a
master collector that reads
packets from a
network
device, and a client that
connects to the master and
displays the
usage
statistics. Argus runs on
BSD, Linux, and most
other UNIX systems.
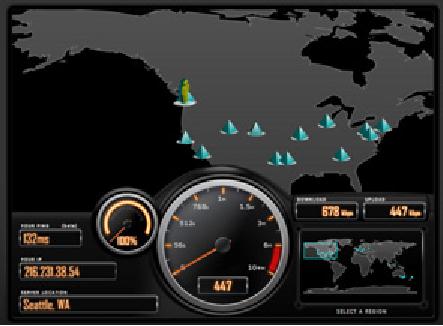
Chapter
6: Security & Monitoring
197
NeTraMet
http://freshmeat.net/projects/netramet/.
NeTraMet
is another
popular flow
analysis
tool. Like Argus, NeTraMet
consists of two parts: a
collector that
gathers
statistics via SNMP, and a
manager that specifies which
flows
should
be
watched. Flows are
specified using a
simple programming language
that
define
the addresses used on either
end, and can include
Ethernet, IP, proto-
col
information, or other identifiers.
NeTraMet runs on DOS and
most UNIX
systems,
including Linux and
BSD.
Throughput
testing
How
fast can the network
go? What is the actual
usable capacity of a
par-
ticular
network link? You can
get a very good estimate of
your throughput
capacity
by flooding
the link with
traffic and
measuring how long it takes
to
transfer
the data.
Figure
6.21: Tools such as this
one from SpeedTest.net are
pretty, but don't
always
give
you an accurate picture of
network performance.
While
there are web pages available that
will perform a "speed test" in
your
browser
(such as http://www.dslreports.com/stest
or http://speedtest.net/),
these
tests are increasingly inaccurate as you
get further from the testing
source.
Even
worse, they do not allow
you to test the speed of a
given link, but only
the
speed
of your link to a particular site on
the Internet. Here are a few
tools that
will
allow you to perform
throughput testing on your
own networks.
198
Chapter
6: Security & Monitoring
ttcp
http://ftp.arl.mil/ftp/pub/ttcp/. Now a
standard part of most
Unix-like sys-
tems,
ttcp
is
a simple network performance
testing tool. One instance
is run
on
either side of the link
you want to test. The
first
node runs in receive
mode,
and the other
transmits:
node_a$
ttcp -r
-s
node_b$
ttcp
-t -s node_a
ttcp-t:
buflen=8192,
nbuf=2048, align=16384/0, port=5001 tcp ->
node_a
ttcp-t:
socket
ttcp-t:
connect
ttcp-t:
16777216
bytes in 249.14 real seconds = 65.76
KB/sec +++
ttcp-t:
2048
I/O calls, msec/call = 124.57, calls/sec = 8.22
ttcp-t:
0.0user
0.2sys 4:09real 0% 0i+0d 0maxrss 0+0pf
7533+0csw
After
collecting data in one direction,
you should reverse the
transmit and receive
partners
to test the link in the
other direction. It can test UDP as
well as TCP
streams,
and can alter various TCP
parameters and buffer lengths to
give the
network
a good workout. It can even
use a user-supplied data stream
instead of
sending
random data. Remember that the
speed readout is in kilobytes,
not
kilobits.
Multiply the result by 8 to find
the speed in kilobits per
second.
The
only real disadvantage to ttcp is that it
hasn t
been
developed in years. For-
tunately,
the code has been released
in the public domain and is
freely available.
Like
ping and traceroute, ttcp is
found as a standard tool on
many systems.
iperf
http://dast.nlanr.net/Projects/Iperf/. Much
like ttcp, iperf
is
a commandline
tool
for estimating the
throughput of a network connection. It
supports many
of
the same features as ttcp,
but uses a "client" and
"server" model instead
of
a
"receive" and "transmit"
pair. To run iperf, launch a
server on one side
and
a
client on the other:
node_a$
iperf
-s
node_b$
iperf -c
node_a
------------------------------------------------------------
Client
connecting to node_a, TCP port
5001
TCP
window size: 16.0 KByte (default)
------------------------------------------------------------
[
5] local 10.15.6.1 port 1212 connected with
10.15.6.23 port 5001
[
ID] Interval
Transfer
Bandwidth
[
5] 0.0-11.3 sec
768
KBytes
558
Kbits/sec
The
server side will continue to
listen and accept client
connections on port
5001
until you hit control-C to
kill it. This can
make it handy when
running
multiple
test runs from a variety of
locations.
Chapter
6: Security & Monitoring
199
The
biggest difference between
ttcp and iperf is that
iperf is under active
de-
velopment,
and has many new
features (including IPv6
support). This makes
it
a good choice as a performance
tool when building new
networks.
bing
http://fgouget.free.fr/bing/index-en.shtml. Rather
than flood a
connection
with
data and see how
long the transfer takes to
complete, Bing
attempts
to
estimate
the available throughput of a
point-to-point connection by
analyzing
round
trip times for various
sized ICMP packets. While it
is not always as
accurate
as a flood
test, it can provide a good
estimate without transmitting
a
large
number of bytes.
Since
bing works using standard
ICMP echo requests, so it
can estimate
available
bandwidth without the need
to run a special client on
the other end,
and
can even attempt to estimate
the throughput of links
outside your net-
work.
Since it uses relatively
little bandwidth, bing can
give you a rough
idea
of
network performance without
running up the charges that
a flood
test
would
certainly incur.
Realtime
tools
It
is desirable to find out when
people are trying to break into your
network, or
when
some part of the network has
failed. Because no system administrator
can
be
monitoring a network all the
time, there are programs that constantly
monitor
the
status of the network and
can send alerts when notable
events occur. The
following
are some open source
tools that can help
perform this task.
Snort
Snort
(http://www.snort.org/) is a packet
sniffer and logger which
can be
used
as a lightweight network intrusion
detection system. It features
rule-
based
logging and can perform
protocol analysis, content
searching, and
packet
matching. It can be used to
detect a variety of attacks
and probes,
such
as stealth port scans, CGI
attacks, SMB probes, OS fingerprinting
at-
tempts,
and many other kinds of
anomalous traffic patterns.
Snort has a real-
time
alert capability that can
notify administrators about
problems as they
occur
with a variety of
methods.
Installing
and running Snort is not
trivial, and depending on
the amount of
network
traffic, will
likely require a dedicated
monitoring machine with
con-
siderable
resources. Fortunately, Snort is
very well documented and
has a
strong
user community. By implementing a
comprehensive Snort rule
set,
you
can identify unexpected
behavior that would
otherwise mysteriously
eat
up
your Internet
bandwidth.
200
Chapter
6: Security & Monitoring
See
http://snort.org/docs/
for an
extensive list of installation
and configura-
tion
resources.
Apache:
mod_security
ModSecurity
(http://www.modsecurity.org/) is an open
source intrusion de-
tection
and prevention engine for
web applications. This kind
of security tool
is
also known as a web
application firewall. ModSecurity
increases web
application
security by protecting web
applications from known and
unknown
attacks.
It can be used on its own,
or as a module in the Apache
web server
(http://www.apache.org/).
There
are several sources for
updated mod_security rules
that help protect
against
the latest security
exploits. One excellent
resource is GotRoot,
which
maintains
a huge and frequently
updated repository of
rules:
http://gotroot.com/tiki-index.php?page=mod_security+rules
Web
application security is important in
defending against attacks on
your
web
server, which could result
in the theft of valuable or
personal data, or in
the
server being used to launch
attacks or send spam to
other Internet users.
As
well as being damaging to
the Internet as a whole,
such intrusions can
seriously
reduce your available
bandwidth.
Nagios
Nagios
(http://nagios.org/) is a program
that monitors hosts and
services on
your
network, notifying you
immediately when problems
arise. It can send
notifications
via email, SMS, or by
running a script, and will
send notifications
to
the relevant person or group
depending on the nature of
the problem.
Nagios
runs on Linux or BSD, and
provides a web interface to
show up-to-
the-minute
system status.
Nagios
is extensible, and can
monitor the status of
virtually any network
event.
It performs checks by running
small scripts at regular
intervals, and
checks
the results against an
expected response. This can
yield much more
sophisticated
checks than a simple network
probe. For example, ping
(page
185)
may tell you that a
machine is up, and nmap
may report that a TCP
port
responds
to requests, but Nagios can
actually retrieve a web page
or make a
database
request, and verify that
the response is not an
error.
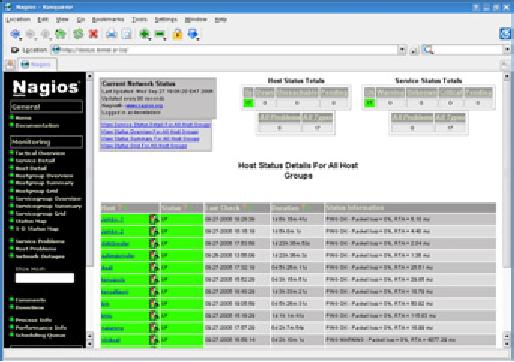
Chapter
6: Security & Monitoring
201
Figure
6.22: Nagios keeps you
informed the moment a
network fault or
service
outage occurs.
Nagios
can even notify you
when bandwidth usage, packet
loss, machine
room
temperature, or other network
health indicator crosses a
particular
threshold.
This can give you
advance warning of network
problems, often al-
lowing
you to respond to the
problem before users have a
chance to complain.
Zabbix
Zabbix
(http://www.zabbix.org/) is an open
source realtime monitoring
tool
that
is something of a hybrid between
Cacti and Nagios. It uses a
SQL data-
base
for data storage, has
its own graph rendering
package, and performs
all
of
the functions you would
expect from a modern
realtime monitor (such
as
SNMP
polling and instant
notification of
error conditions). Zabbix is
released
under
the GNU General Public
License.
Other
useful tools
There
are thousands of free network monitoring
tools that fill very specialized
needs.
Here are a few of our
favorites that don't quite fit into the
above categories.
Driftnet
and Etherpeg.
These
tools decode graphical data
(such as GIF and JPEG files)
and display
them
as a collage. As mentioned earlier, tools
such as these are of limited
use in

202
Chapter
6: Security & Monitoring
troubleshooting
problems, but are very
valuable for demonstrating the
insecurity
of
unencrypted protocols. Etherpeg
is
available from http://www.etherpeg.org/,
and
Driftnet
can
be downloaded at http://www.ex-parrot.com/~chris/driftnet/.
Figure
6.23: A web collage
generated by Etherpeg.
ngrep
Ngrep
provides
most of GNU grep's pattern
matching features, but
applies
them
to network traffic. It
currently recognizes IPv4
and IPv6, TCP,
UDP,
ICMP,
IGMP, PPP, SLIP, FDDI,
Token Ring, and much
more. As it makes
extensive
use of regular expression
matches, it is a tool suited to
advanced
users
or those that have a good
knowledge of regular
expressions.
But
you don't necessarily need
to be a regex expert to be able to
make basic
use
of ngrep. For example, to
view all packets that
contain the string
GET
(presumably
HTTP requests), try
this:
#
ngrep -q GET
Pattern
matches can be constrained
further to match particular
protocols,
ports,
or other criteria using BPF
filters.
This is the filter
language used by
common
packet sniffing tools,
such as tcpdump and snoop.
To view GET or
POST
strings sent to destination
port 80, use this
command line:
#
ngrep -q 'GET|POST' port 80
Chapter
6: Security & Monitoring
203
By
using ngrep creatively, you
can detect anything from
virus activity to
spam
email.
You can download ngrep at
http://ngrep.sourceforge.net/.
What
is normal?
If
you are looking for a
definitive
answer as to what your
traffic
patterns
should
look
like, you are going to be
disappointed. There is no absolute
right
answer
to this question, but given
some work you can
determine what is
normal
for your network. While
every environment is different,
some of the
factors
that can influence
the appearance of your
traffic patterns
are:
�
The capacity of your
Internet connection
�
The number of users that
have access to the
network
�
The social policy (byte
charging, quotas, honor
system, etc.).
�
The number, types, and
level of services
offered
�
The health of the network
(presence of viruses, excessive
broadcasts,
routing
loops, open email relays,
denial of service attacks,
etc.).
�
The competence of your
computer users
�
The location and
configuration of control structures
(firewalls, proxy
servers,
caches,
and so on)
This
is not a definitive
list, but should give
you an idea of how a wide
range of
factors
can affect your bandwidth
patterns. With this in mind,
let's look at the
topic
of baselines.
Establishing
a baseline
Since
every environment is different,
you need to determine for
yourself
what
your traffic patterns look
like under normal
situations. This is
useful
because
it allows you to identify
changes over time, either
sudden or grad-
ual.
These changes may in turn
indicate a problem, or a potential
future
problem,
with your network.
For
example, suppose that your
network grinds to a halt,
and you are
not
sure
of the cause. Fortunately,
you have decided to keep a
graph of
broadcasts
as a percentage of the overall
network traffic. If this
graph
shows
a sudden increase in the
amount of broadcast traffic, it
may mean
that
your network has been
infected with a virus.
Without an idea of what
is
"normal"
for your network (a
baseline), you would not be
able to see that
the
number of broadcasts had
increased, only that it was
relatively high,
which
may not indicate a
problem.
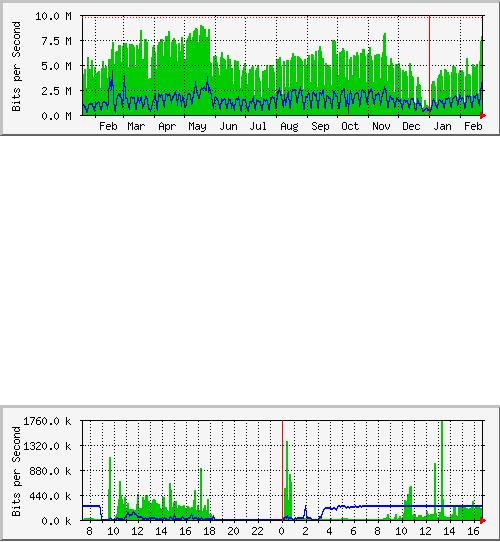
204
Chapter
6: Security & Monitoring
Baseline
graphs and figures
are also useful when
analyzing the effects
of
changes
made to the network. It is
often very useful to
experiment with such
changes
by trying different possible
values. Knowing what the
baseline looks
like
will show you whether
your changes have improved
matters, or made
them
worse.
Figure
6.24: By collecting data
over a long period of time,
you can predict the
growth
of
your network and make
changes before problems
develop.
In
Figure
6.24, we can
see the effect the
implementation of delay pools
has
made
on Internet utilization around
the period of May. If we did
not keep a
graph
of the line utilization, we
would never know what
the effect of the
change
over the long term
was. When watching a total
traffic graph
after
making
changes, don't assume that
just because the graph
does not change
radically
that your efforts were
wasted. You might have
removed frivolous
usage
from your line only to
have it replaced by genuine
legitimate traffic.
You
could then combine this
baseline with others, say
the top 100 sites
ac-
cessed
or the average utilization by
your top twenty users, to
determine if
habits
have simply changed. As we
will see later, MRTG,
RRDtool, and Cacti
are
excellent tools you can
use to keep a
baseline.
Figure
6.25: The traffic
trend at Aidworld logged
over a single
day.
Figure
6.25 shows
traffic on an
Aidworld firewall
over a period of 24
hours.
There
is nothing apparently wrong
with this graph, but
users were complain-
ing
about slow Internet
access.
Figure
6.26 shows
that the upload bandwidth
use (dark area) was
higher
during
working hours on the last
day than on previous days. A
period of
heavy
upload usage started every
morning at 03:00, and was
normally fin-
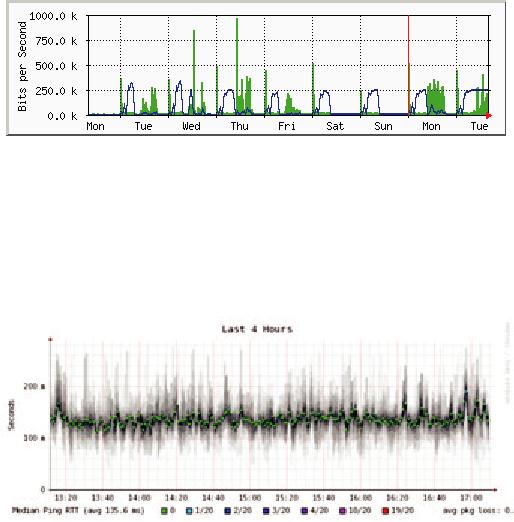
Chapter
6: Security & Monitoring
205
ished
by 09:00, but on the last
day it was still running at
16:30. Further in-
vestigation
revealed a problem with the
backup software, which ran
at
03:00
every day.
Figure
6.26: The same network
logged over an entire week
reveals a problem
with
backups,
which caused unexpected
congestion for network
users.
Figure
6.27 shows
measurements of latency on the
same connection as
measured
by a program called SmokePing.
The position of the dots
shows
the
average latency, while the
gray smoke indicates the
distribution of latency
(jitter).
The color of the dots
indicates the number of lost
packets. This graph
over
a period of four hours does
not help to identify whether
there are any
problems
on the network.
Figure
6.27: Four hours of jitter
and packet loss.
The
next graph (Figure
6.28) shows
the same data over a
period of 16
hours.
This indicates that the
values in the graph above
are close to the
nor-
mal
level (baseline), but that
there were significant
increases in latency at
several
times during the early
morning, up to 30 times the
baseline value.
This
indicates that additional
monitoring should be performed
during these
early
morning periods to establish
the cause of the high
latency, which is
probably
heavy traffic of some
kind.
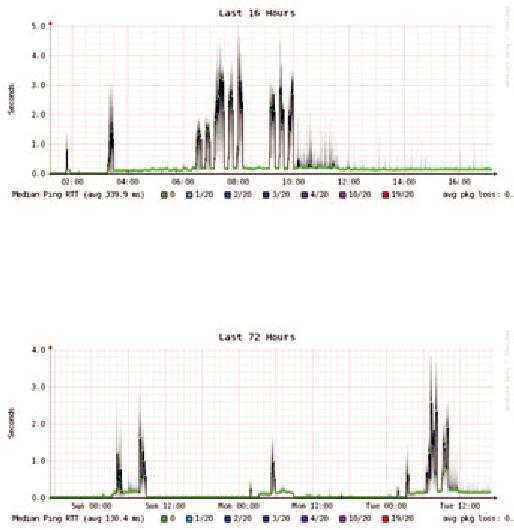
206
Chapter
6: Security & Monitoring
Figure
6.28: A higher spread of
jitter is revealed in the 16
hour log.
Figure
6.29 shows
that Tuesday was
significantly
worse than Sunday or
Monday
for latency, especially
during the early morning
period. This might
indicate
that something has changed
on the network.
Figure
6.29: Zooming out to the
week long view reveals a
definite
repetition of in-
creased
latency and packet loss in
the early morning
hours.
How
do I interpret the traffic
graph?
In
a basic network flow graph
(such as that generated by
the network monitor
MRTG),
the green area indicates
inbound
traffic, while
the blue line
indi-
cates
outbound
traffic. Inbound
traffic is
traffic that
originates from
another
network
(typically the Internet) and
is addressed to a computer inside
your
network.
Outbound traffic is
traffic that
originates from your
network, and is
addressed
to a computer somewhere on the
Internet. Depending on
what
sort
of network environment you
have, the graph will
help you understand
how
your network is actually
being used. For example,
monitoring of servers
usually
reveals larger amounts of
outbound traffic as the
servers respond to
requests
(such as sending mail or
serving web pages), while
monitoring cli-
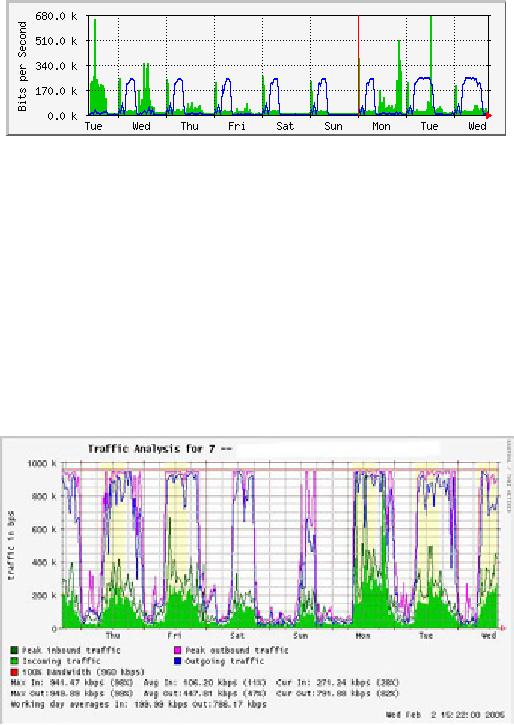
Chapter
6: Security & Monitoring
207
ent
machines might reveal higher
amounts of inbound traffic to the
machines
as
they receive data from
the servers.
Figure
6.30: The classic network
flow
graph. The dark area
represents inbound
traf-
fic,
while the line represents
outbound traffic.
The repeating arcs of
outbound traffic
show
when the nightly backups
have run.
Traffic
patterns will vary with
what you are monitoring. A
router will normally
show
more incoming traffic than
outgoing traffic as users
download data from
the
Internet. An excess of outbound
bandwidth that is not
transmitted by your
network
servers may indicate a
peer-to-peer client, unauthorized
server, or
even
a virus on one or more of
your clients. There are no
set metrics that
indicate
what outgoing traffic to incoming
traffic should
look like. It is up to
you
to establish a baseline to understand
what normal network
traffic
pat-
terns
look like on your
network.
Detecting
network overload
Figure
6.31 shows
traffic on an
overloaded Internet
connection.
Figure
6.31: Flat-topped graphs
indicate that a line is
using the maximum
available
bandwidth,
and is overutilized during
these times.
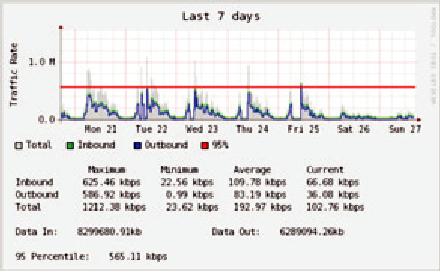
208
Chapter
6: Security & Monitoring
The
most apparent sign of
overloading is the flat tops on
outbound traffic
during
the middle of every day.
Flat tops may indicate
overloading, even if
they
are well below the
maximum theoretical capacity of
the link. In this
case
it
may indicate that you
are not getting as much
bandwidth from your
service
provider
as you expect.
Measuring
95th percentile
The
95th percentile is a widely
used mathematical calculation to
evaluate
regular
and sustained utilization of a
network pipe. Its value
shows the high-
est
consumption of traffic for a
given period. Calculating
the 95th percentile
means
that 95% of the time
the usage is below a certain
amount, and 5% of
the
time usage is above that
amount. The 95th percentile
is a good value to
use
to show the bandwidth that
is actually used at least
95% of the time.
Figure
6.32: The horizontal line
shows the 95th percentile
amount.
MRTG
and Cacti will calculate
the 95th Percentile for
you. This is a sample
graph
of a 960 kbps connection.
The 95th percentile came to
945 kbps after
discarding
the highest 5% of traffic.
Monitoring
RAM and CPU usage
By
definition, servers provide
critical services that
should always be
available.
Servers
receive and respond to
client machine requests,
providing access to
services
that are the whole
point of having a network in
the first place.
There-
fore,
servers must have sufficient
hardware capabilities to accommodate
the
work
load. This means they
must have adequate RAM,
storage, and process-
ing
power to accommodate the
number of client requests.
Otherwise, the
server
will take longer to respond,
or in the worst case, may be
incapable of
responding
at all. Since hardware
resources are finite, it is
important to keep
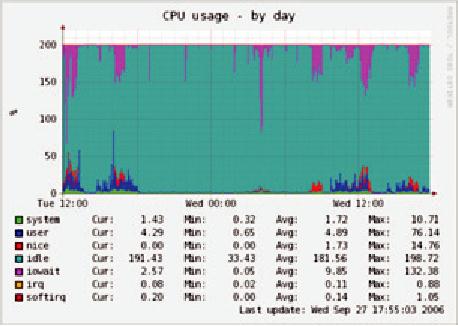
Chapter
6: Security & Monitoring
209
track
of how system resources are
being used. If a core server
(such as a
proxy
server or email server) is
overwhelmed by requests, access
times be-
come
slow. This is often
perceived by users as a network
problem.
There
are several programs that
can be used to monitor
resources on a
server.
The simplest method on a
Windows machine is to access
the Task
Manager
using the Ctrl
Alt + Del keys,
and then click on the
Performance
tab.
On a Linux or BSD box, you
can type top
in
a terminal window. To
keep
historical
logs of such performance,
MRTG or RRDtool (on
Page
190)
can
also
be used.
Figure
6.33: RRDtool can show
arbitrary data, such as
memory and CPU
usage,
expressed
as an average over
time.
Mail
servers require adequate
space, as some people may
prefer to leave their
email
messages on the server for
long periods of time. The
messages can ac-
cumulate
and fill the hard
disk, especially if quotas
are not in use. If the
disk or
partition
used for mail storage
fills up, the mail
server cannot receive mail.
If
that
disk is also used by the
system, all kinds of system
problems may occur
as
the operating system runs
out of swap space and
temporary storage.
File
servers need to be monitored,
even if they have large
disks. Users will
find
a way to fill any size
disk more quickly than
you might think. Disk
us-
age
can be enforced through the
use of quotas, or by simply
monitoring
usage
and telling people when
they are using too
much. Nagios (see Page
200)
can notify you when
disk usage, CPU utilization,
or other system re-
sources
cross a critical
threshold.
210
Chapter
6: Security & Monitoring
If
a machine becomes unresponsive or
slow, and measurements show
that a
system
resource is being heavily
used, this may be an
indication that an
up-
grade
is required. If processor usage
constantly exceeds 60% of
the total, it
may
be time to upgrade the
processor. Slow speeds could
also be as a result
of
insufficient
RAM. Be sure to check the
overall usage of CPU, RAM,
and
disk
space before deciding to
upgrade a particular
component.
A
simple way to check whether
a machine has insufficient
RAM is to look at the
hard
disk light. When the
light is on constantly, it usually
means that the
ma-
chine
is constantly swapping large
amounts of data to and from
the disk. This
is
known as thrashing, and is
extremely bad for
performance. It can usually
be
fixed
by investigating which process is
using the most RAM,
and killing or re-
configuring
that process. Failing that,
the system needs more
RAM.
You
should always determine
whether it is more cost
effective to upgrade an
individual
component or purchase a whole
new machine. Some
computers
are
difficult or
impossible to upgrade, and it
often costs more to replace
indi-
vidual
components than to replace
the entire system. Since
the availability of
parts
and systems varies widely
around the world, be sure to
weigh the cost
of
parts vs. whole systems,
including shipping and
taxes, when
determining
the
cost of upgrading.
Table of Contents:
- Where to Begin:Purpose of this book, Fitting wireless into your existing network, Wireless networking protocols
- A Practical Introduction to Radio Physics:What is a wave?, Polarization
- Network Design:Designing the physical network, Mesh networking with OLSR, Estimating capacity
- Antennas & Transmission Lines:Cables, Waveguides, Connectors and adapters, Amplifiers
- Networking Hardware:Wired wireless, Choosing wireless components, Building an access point from a PC
- Security & Monitoring:Physical security, Threats to the network, Authentication
- Solar Power:Solar energy, Photovoltaic system components, The battery
- Building an Outdoor Node:Waterproof enclosures, Providing power, Mounting considerations
- Troubleshooting:Building your team, Proper troubleshooting technique, Common network problems
- Economic Sustainability:Create a Mission Statement, Evaluate the Demand for Potential Offerings
- Case Studies:General advice, Crossing the divide with a simple bridge in Timbuktu, Networking Mérida State
- Appendix A: Resources:Antennas and antenna design, Security
- Appendix B: Channel Allocations
- Appendix C: Path Loss
- Appendix D: Cable Sizes
- Appendix E: Solar Dimensioning:General Data, Component Characteristics
- Glossary