 |

Page
17 of 97
Chapter 6
-
Discussion centers on fiber optic
products that can be used to serve
serial data
communications.
Chapter 7
-
Standards that cover the
use of fiber optic data
links within premises
networks are
enumerated.
Organization from which they
can be ordered, in full, are
provided.
Chapter
8 -
A glossary that covers the
subject of fiber optic data
communications. It provides
terminology
specifically covered within
this book. However, it goes
further and provides
terminology
that
may not be used here but
may be encountered within a broader
view of the interest area or
within
communications
in general.
CHAPTER
2
THE
FIBER OPTIC DATA COMMUNICATIONS LINK FOR THE
PREMISES
ENVIRONMENT
2.1
The Fiber Optic Data
Communications Link,
End-to-End
In
this chapter we consider the
simple fiber optic data
link for the premises
environment. This is
the
basic
building block for a fiber
optic based network. A model
of this simple link is shown
in Figure 2-1.
Figure
2-1: Model of "simple" fiber
optic data link
The
illustration indicates the
Source-User pair, Transmitter and
Receiver. It also clearly shows
the fiber
optic
cable constituting the Transmission
Medium as well as the
connectors that provide the
interface of
the
Transmitter to the Transmission
Medium and the Transmission
Medium to the
Receiver.
All
of these are components of
the simple fiber optic
data link. Each will be discussed.
Consideration
will
be in the following order:
fiber optic cable, Transmitter,
Receiver and connectors. We will
conclude
by
taking up the question of
how to analyze the
performance of the simple
fiber optic data
link.
2.2
Fiber Optic Cable
We
begin by asking Just what is a
fiber optic cable? A fiber
optic cable is a cylindrical pipe. It
may be
made
out of glass or plastic or a
combination of glass and plastic. It is
fabricated in such a way
that this
pipe
can guide light from one end of it to
the other.
The
idea of having light guided
through bent glass is not
new or high tech. The
author was once
Page
18 of 97
informed
that Leonardo DaVinci
actually mentioned such a
means for guiding light in
one of his
notebooks.
However, he has not been
able to verify this assertion. What is
known for certain is that
total
internal
reflection of light in a beam of
water - essentially guided
light - was demonstrated by the
physicist
John Tyndall [1820-1893] in
either 1854 or 1870 - depending upon
which reference you
consult.
Tyndall showed that light
could be bent around a
corner while it traveled
through a jet of
pouring
water.
Using
light for communications
came after this. Alexander
Graham Bell [1847-1922]
invented the
photo-phone
around 1880. Bell demonstrated
that a membrane in response to
sound could modulate
an
optical
signal, light. But, this was
a free space transmission
system. The light was not
guided.
Guided
optical communications had to wait
for the 20th century.
The first patent on guided
optical
communications
over glass was obtained by AT &T in
1934. However, at that time
there were really no
materials
to fabricate a glass (or
other type of transparent
material) fiber optic cable
with sufficiently
low
attenuation to make guided optical
communications practical. This had to
wait for about
thirty
years.
During
the 1960's researchers
working at a number of different
academic, industrial and
government
laboratories
obtained a much better
understanding of the loss mechanisms in
glass fiber optic
cable.
Between
1968 and 1970 the attenuation of glass
fiber optic cable dropped from
over 1000 dB/km to
less
than
20 dB/km. Corning patented its
fabrication process for the
cable. The continued decrease
in
attenuation
through the 1970's allowed
practical guided light
communications using glass
fiber optic
cable
to take off. In the late
1980's and 1990's this
momentum increased with the
even lower cost
plastic
fiber
optic cable and Plastic Clad
Silica (PCS).
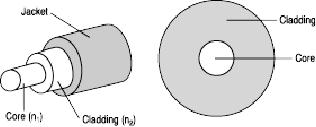
Basically,
a fiber optic cable is composed of
two concentric layers termed
the core and the
cladding.
These
are shown on the right
side of Figure 2-2. The core
and cladding have different
indices of
refraction
with the core having n1 and
the cladding n2.
Light is piped through the
core. A fiber optic
cable
has an additional coating
around the cladding called
the jacket. Core, cladding
and jacket are all
shown
in the three dimensional
view on the left side of
Figure 2-2. The jacket
usually consists of one or
more
layers of polymer. Its role
is to protect the core and cladding
from shocks that might
affect their
optical
or physical properties. It acts as a
shock absorber. The jacket also
provides protection
from
abrasions,
solvents and other contaminants.
The jacket does not
have any optical properties
that might
affect
the propagation of light
within the fiber optic
cable.
The
illustration on the left
side of Figure 2-2 is
somewhat simplistic. In actuality,
there may be a
strength
member added to the fiber
optic cable so that it can be pulled
during installation.
Figure
2-2: Fiber Optic Cable, 3
dimensional view and basic
cross section
Page
19 of 97
This
would be added just inside
the jacket. There may be a
buffer between the strength
member and the
cladding.
This protects the core and
cladding from damage and
allows the fiber optic cable
to be bundled
with
other fiber optic cables.
Neither of these is
shown.
How
is light guided down the
fiber optic cable in the
core? This occurs because
the core and cladding
have
different indices of refraction
with the index of the
core, n1, always being greater than
the index of
the
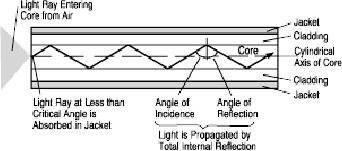
cladding, n2. Figure 2-3 shows
how this is employed to
effect the propagation of
light down the
fiber
optic
cable and confine it to the
core.
As
illustrated a light ray is
injected into the fiber
optic cable on the right. If
the light ray is injected
and
strikes
the core-to-cladding interface at an
angle greater than an entity
called the critical angle
then it is
reflected
back into the core. Since
the angle of incidence is
always equal to the angle of
reflection the
reflected
light will again be reflected. The
light ray will then continue
this bouncing path down
the
length
of the fiber optic cable. If
the light ray strikes
the core-to-cladding interface at an
angle less than
the
critical angle then it
passes into the cladding
where it is attenuated very rapidly
with propagation
distance.
Light
can be guided down the fiber
optic cable if it enters at less than
the critical angle. This
angle is
fixed
by the indices of refraction of
the core and cladding and is given by
the formula:
Θc
= arc cosine (n2 /n1).
The
critical angle is measured
from the cylindrical axis of
the core. By way of example,
if n1 =
1.446
and
n2=
1.430 then a quick
computation will show that
the critical angle is 8.53
degrees, a fairly
small
angle.
Of
course, it must be noted that a
light ray enters the core
from the air outside, to
the left of Figure
2-3.
The
refractive index of the air
must be taken into account
in order to assure that a
light ray in the core
will
be at an angle less than the
critical angle. This can be done
fairly simply. The following
basic rule
then
applies. Suppose a light ray enters
the core from the air at an
angle less than an entity
called the
external
acceptance angle - Θext
It will be guided
down the core.
Here
Θext
= arc sin
[(n1/
n0) sin (Θc)]
with
n0 being the index of
refraction of air. This
angle is, likewise, measured
from the cylindrical axis
of
the
core. In the example above a
computation shows it to be 12.4
degrees - again a fairly small
angle.
Page
20 of 97
Figure
2-3: Propagation of a light
ray down a fiber optic
cable
Fiber
optic data link performance
is a subject that will be discussed in
full at the end of this
chapter.
However,
let's jump the gun
just a little. In considering
the performance of a fiber
optic data link
the
network
architect is interested in the
effect that the fiber
optic cable has on overall
link performance.
Consideration
of performance comes to answering
three questions:
1)
How much light can be
coupled into the core
through the external
acceptance angle?
2)
How much attenuation will a
light ray experience in propagating
down the core?
3)
How much time dispersion will
light rays representing the
same input pulse experience
in propagating
down
the core?
The
more light that can be
coupled into the core the
more light will reach the
Receiver and the lower
the
BER.
The lower the attenuation in
propagating down the core
the more light reaches
the Receiver and
the
lower the BER. The
less time dispersion
realized in propagating down
the core the faster
the
signaling
rate and the higher the
end-to-end data rate from
Source-to-User.
The
answers to these questions depend
upon many factors. The
major factors are the size
of the fiber, the
composition
of the fiber and the mode of
propagation.
When
it comes to size, fiber
optic cables have
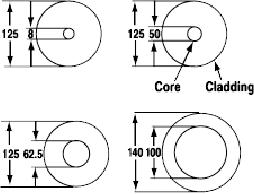
exceedingly small diameters. Figure
2-4 illustrates the
cross
sections of the core and cladding diameters of
four commonly used fiber
optic cables. The
diameter
sizes shown are in microns,
10-6 m. To get some feeling
for how small these
sizes actually are,
understand
that a human hair has a
diameter of 100 microns. Fiber
optic cable sizes are
usually
expressed
by first giving the core size
followed by the cladding size.
Consequently, 50/125 indicates
a
core
diameter of 50 microns and a cladding
diameter of 125 microns; 100/140
indicates a core diameter
of
100 microns and a cladding diameter of
140 microns. The larger the
core the more light can
be
coupled
into it from external
acceptance angle cone.
However, larger diameter
cores may actually
allow
too
much light in and too much
light may cause Receiver
saturation problems. The
left most cable
shown
in Figure 2-4, the 125/8
cable, is often found when a
fiber optic data link
operates with single-
mode
propagation. The cable that is
second from the right in
Figure 2-4, the 62.5/125
cable, is often
found
in a fiber optic data link
that operates with
multi-mode propagation.
Page
21 of 97
Figure
2-4: Typical core and
cladding diameters -Sizes
are in microns
When
it comes to composition or material
makeup fiber optic cables
are of three types: glass,
plastic and
Plastic
Clad Silica (PCS). These three candidate
types differ with respect to
attenuation and cost. We
will
describe these in detail.
Attenuation and cost will first be
mentioned only qualitatively.
Later,
toward
the end of this sub-chapter
the candidates will be compared
quantitatively.
By
the way, attenuation is
principally caused by two
physical effects, absorption and
scattering.
Absorption
removes signal energy in the
interaction between the
propagating light (photons)
and
molecules
in the core. Scattering
redirects light out of the
core to the cladding. When
attenuation for a
fiber
optic cable is dealt with
quantitatively it is referenced for
operation at a particular
optical
wavelength,
a window, where it is
minimized.
Glass
fiber optic cable has the
lowest attenuation and comes at
the highest cost. A pure
glass fiber optic
cable
has a glass core and a glass
cladding. This candidate has, by
far, the most wide
spread use. It has
been
the most popular with
link installers and it is the candidate
with which installers have
the most
experience.
The glass employed in a
fiber optic cable is ultra
pure, ultra transparent,
silicon dioxide or
fused
quartz. One reference put
this in perspective by noting that "if
seawater were as clear as
this type
of
fiber optic cable then you
would be able to see to the
bottom of the deepest trench
in the Pacific
Ocean."
During the glass fiber
optic cable fabrication process
impurities are purposely
added to the pure
glass
so as to obtain the desired
indices of refraction needed to
guide light. Germanium or
phosphorous
are
added to increase the index
of refraction. Boron or fluorine is
added to decrease the index
of
refraction.
Other impurities may somehow
remain in the glass cable
after fabrication. These
residual
impurities
may increase the attenuation
by either scattering or absorbing
light.
Plastic
fiber optic cable has the
highest attenuation, but
comes at the lowest cost.
Plastic fiber optic
cable
has
a plastic core and plastic cladding.
This fiber optic cable is
quite thick. Typical
dimensions are
480/500,
735/750 and 980/1000. The core
generally consists of PMMA
(polymethylmethacrylate)
coated
with a fluropolymer. Plastic
fiber optic cable was pioneered in Japan
principally for use in
the
automotive
industry. It is just beginning to
gain attention in the
premises data communications
market in
the
United States. The increased
interest is due to two reasons.
First, the higher
attenuation relative to
glass
may not be a serious obstacle with
the short cable runs often
required in premise networks.
Secondly,
the cost advantage sparks interest
when network architects are
faced with budget decisions.
Plastic
fiber optic cable does have
a problem with flammability.
Because of this, it may not
be
appropriate
for certain environments and
care has to be given when it
is run through a
plenum.
Otherwise,
plastic fiber is considered extremely
rugged with a tight bend
radius and the ability
to
Page
22 of 97
withstand
abuse.
Plastic
Clad Silica (PCS) fiber
optic cable has an attenuation
that lies between glass and
plastic and a
cost
that lies between their cost
as well. Plastic Clad Silica
(PCS) fiber optic cable has a
glass core
which
is often vitreous silica
while the cladding is
plastic - usually a silicone
elastomer with a
lower
refractive
index. In 1984 the IEC standardized
PCS fiber optic cable to
have the following
dimensions:
core
200 microns, silicone elastomer
cladding 380 microns, jacket 600
microns. PCS fabricated with
a
silicone
elastomer cladding suffers
from three major defects. It
has considerable plasticity. This
makes
connector
application difficult. Adhesive
bonding is not possible and it is
practically insoluble in
organic
solvents.
All of this makes this type
of fiber optic cable not
particularly popular with
link installers.
However,
there have been some
improvements in it in recent
years.
When
it comes to mode of propagation fiber
optic cable can be one of two types,
multi-mode or single-
mode.
These provide different performance
with respect to both
attenuation and time dispersion.
The
single-mode
fiber optic cable provides
the better performance at,
of course, a higher cost.
In
order to understand the
difference in these types an
explanation must be given of
what is meant by
mode
of propagation.
Light
has a dual nature and can be
viewed as either a wave
phenomenon or a particle
phenomenon
(photons).
For the present purposes
consider it as a wave. When
this wave is guided down a
fiber optic
cable
it exhibits certain modes. These
are variations in the
intensity of the light, both
over the cable cross
section
and down the cable length. These
modes are actually numbered
from lowest to highest. In a
very
simple
sense each of these modes
can be thought of as a ray of light.
Although, it should be noted
that
the
term ray of light is a hold
over from classical physics
and does not really describe
the true nature of
light.
In
any case, view the
modes as rays of light. For
a given fiber optic cable
the number of modes that
exist
depend
upon the dimensions of the
cable and the variation of the
indices of refraction of both core
and
cladding
across the cross section.
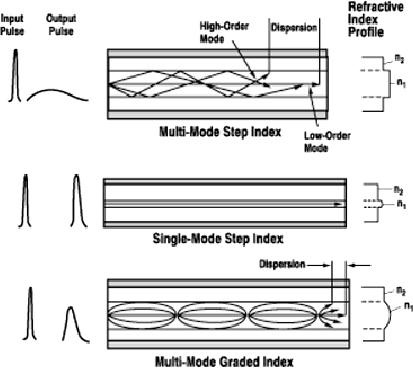
There are three principal
possibilities. These are illustrated in
Figure
2-5.
Consider
the top illustration in
Figure 2-5. This diagram
corresponds to multi-mode propagation
with a
refractive
index profile that is called
step index. As can be seen
the diameter of the core is
fairly large
relative
to the cladding. There is also a sharp
discontinuity in the index of
refraction as you go from
core
to
cladding. As a result, when
light enters the fiber optic
cable on the right it propagates
down toward
the
left in multiple rays or
multiple modes. This yields
the designation multi-mode. As
indicated the
lowest
order mode travels straight
down the center. It travels
along the cylindrical axis
of the core. The
higher
modes represented by rays,
bounce back and forth, going
down the cable to the left.
The higher
the
mode the more bounces per unit distance
down to the left.
Over
to the left of this top
illustration are shown a candidate
input pulse and the
resulting output
pulse.
Note
that the output pulse is
significantly attenuated relative to
the input pulse. It also
suffers significant
time
dispersion. The reasons for
this are as follows. The
higher order modes, the
bouncing rays, tend
to
leak
into the cladding as they
propagate down the fiber
optic cable. They lose some of
their energy into
heat.
This results in an attenuated
output signal. The input
pulse is split among the
different rays that
travel
down the fiber optic cable.
The bouncing rays and the
lowest order mode, traveling
down the
center
axis, are all traversing
paths of different lengths from
input to output. Consequently,
they do not
all
reach the right end of the
fiber optic cable at the
same time. When the
output pulse is
constructed
from
these separate ray
components the result is
time dispersion.
Page
23 of 97
Figure
2-5: Types of mode
propagation in fiber optic cable
(Courtesy of AMP
Incorporated)
Fiber
optic cable that exhibits
multi-mode propagation with a
step index profile is
thereby characterized
as
having higher attenuation and
more time dispersion than
the other propagation
candidates have.
However,
it is also the least costly and in the
premises environment the
most widely used. It is
especially
attractive
for link lengths up to 5 km.
Usually, it has a core diameter
that ranges from 100 microns
to
970
microns. It can be fabricated either
from glass, plastic or
PCS.
Consider
the middle illustration in
Figure 2-5. This diagram
corresponds to single-mode
propagation
with
a refractive index profile
that is called step index.
As can be seen the diameter of
the core is fairly
small
relative to the cladding.
Typically, the cladding is
ten times thicker than
the core. Because of
this
when
light enters the fiber optic
cable on the right it propagates
down toward the left in
just a single ray,
a
single-mode, and the lowest
order mode. In extremely
simple terms this lowest
order mode is confined
to
a thin cylinder around the
axis of the core. (In
actuality it is a little more
complex). The higher
order
modes
are absent. Consequently,
there is no energy lost to heat by
having these modes leak
into the
cladding.
They simply are not present.
All energy is confined to this
single, lowest order, mode.
Since
the
higher order mode energy is
not lost, attenuation is not
significant. Also, since the
input signal is
confined
to a single ray path, that
of the lowest order mode,
there is little time
dispersion, only that
due
to
propagation through the
non-zero diameter, single mode
cylinder.
Single
mode propagation exists only above a
certain specific wavelength
called the cutoff
wavelength.
To
the left of this middle
illustration is shown a candidate input
pulse and the resulting
output pulse.
Comparing
the output pulse and the
input pulse note that
there is little attenuation and
time dispersion.
Fiber
optic cable that exhibits
single-mode propagation is thereby
characterized as having
lower
Page
24 of 97
attenuation
and less time dispersion
than the other propagation
candidates have. Less time
dispersion of
course
means higher bandwidth and
this is in the 50 to 100 GHz/ km range.
However, single mode
fiber
optic
cable is also the most costly in
the premises environment.
For this reason, it has been
used more
with
Wide Area Networks than
with premises data
communications. It is attractive more
for link lengths
go
all the way up to 100 km.
Nonetheless, single-mode fiber
optic cable has been getting
increased
attention
as Local Area Networks have
been extended to greater distances
over corporate campuses.
The
core
diameter for this type of
fiber optic cable is exceedingly
small ranging from 5 microns
to 10
microns.
The standard cladding diameter is 125
microns.
Single-mode
fiber optic cable is fabricated
from glass. Because of the
thickness of the core,
plastic
cannot
be used to fabricate single-mode
fiber optic cable. The
author is unaware of PCS
being used to
fabricate
it.
It
should be noted that not
all single-mode fibers use a
step index profile. Some
use more complex
profiles
to optimize performance at a particular
wavelength.
Consider
the bottom illustration in
Figure 2-5. This corresponds to
multi-mode propagation with
a
refractive
index profile that is called
graded index. Here the
variation of the index of
refraction is
gradual
as it extends out from the
axis of the core through the
core to the cladding. There is no
sharp
discontinuity
in the indices of refraction
between core and cladding. The core here
is much larger than
in
the
single-mode step index case
discussed above. Multi-mode propagation
exists with a graded
index.
However,
as illustrated the paths of the
higher order modes are
somewhat confined. They
appear to
follow
a series of ellipses. Because
the higher mode paths are
confined the attenuation
through them due
to
leakage is more limited than
with a step index. The
time dispersion is more
limited than with a
step
index,
therefore, attenuation and time
dispersion are present, just
limited.
To
the left of this bottom
illustration is shown a candidate input
pulse and the resulting
output pulse.
When
comparing the output pulse
and the input pulse, note
that there is some
attenuation and time
dispersion,
but not nearly as great as
with multi-mode step index
fiber optic cable.
Fiber
optic cable that exhibits
multi-mode propagation with a
graded index profile is
thereby
characterized
as having attenuation and time
dispersion properties somewhere
between the other
two
candidates.
Likewise its cost is somewhere between
the other two candidates.
Popular graded index
fiber
optic
cables have core diameters of 50,
62.5 and 85 microns. They
have a cladding diameter of
125
microns
- the same as single-mode
fiber optic cables. This
type of fiber optic cable is
extremely popular
in
premise data communications applications.
In particular, the 62.5/125
fiber optic cable is the
most
popular
and most widely used in
these applications.
Glass
is generally used to fabricate
multi-mode graded index
fiber optic cable. However,
there has been
some
work at fabricating it with
plastic.
The
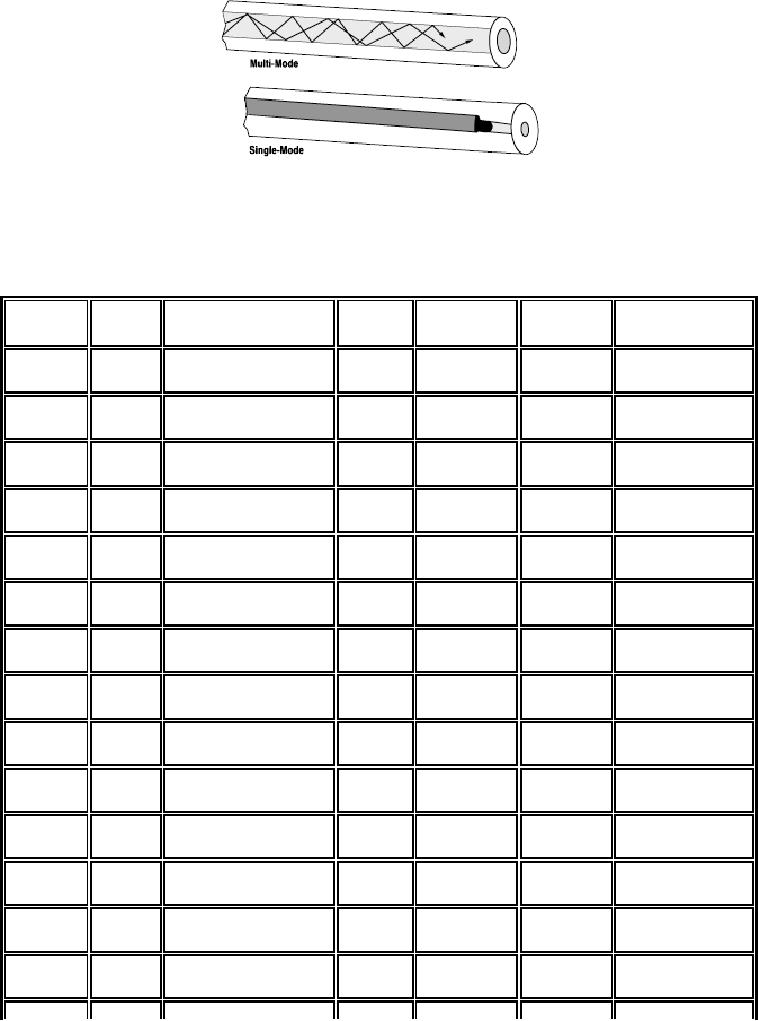
illustration Figure 2-6
provides a three dimensional
view of multi-mode and
single-mode
propagation
down a fiber optic cable.
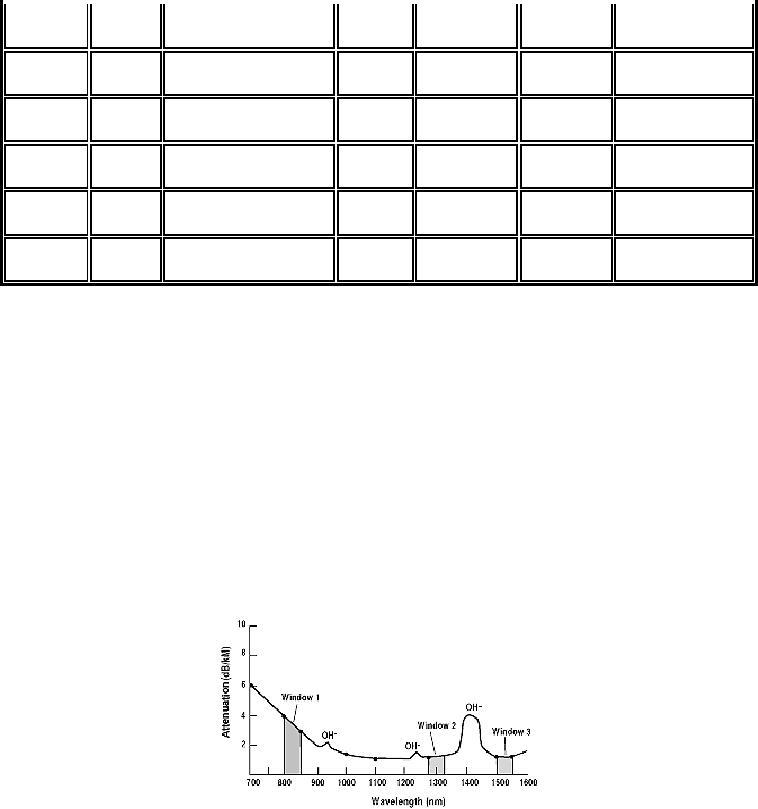
Table 2-1 provides the
attenuation and bandwidth
characteristics
of
the different fiber optic
cable candidates. This table is far
from being all inclusive,
however, the
common
types are represented.
Page
25 of 97
Figure
2-6: Three dimensional view,
optical power in multi-mode
and single-mode
fibers
Index
of Refraction
Size
Atten.
Bandwidth
λ
Mode
Material
Profile
(microns)
dB/km
MHz/km
microns
Multi-
Glass
Step
800
62.5/125
5.0
6
mode
Multi-
Glass
Step
850
62.5/125
4.0
6
mode
Multi-
Glass
Graded
850
62.5/125
3.3
200
mode
Multi-
Glass
Graded
850
50/125
2.7
600
mode
Multi-
Glass
Graded
1300
62.5/125
0.9
800
mode
Multi-
Glass
Graded
1300
50/125
0.7
1500
mode
Multi-
Glass
Graded
850
85/125
2.8
200
mode
Multi-
Glass
Graded
1300
85/125
0.7
400
mode
Multi-
Glass
Graded
1550
85/125
0.4
500
mode
Multi-
Glass
Graded
850
100/140
3.5
300
mode
Multi-
Glass
Graded
1300
100/140
1.5
500
mode
Multi-
Glass
Graded
1550
100/140
0.9
500
mode
Multi-
Plastic
Step
650
485/500
240
5
@ 680
mode
Multi-
Plastic
Step
650
735/750
230
5
@ 680
mode
Page
26 of 97
Multi-
Plastic
Step
650
980/1000
220
5
@ 680
mode
Multi-
PCS
Step
790
200/350
10
20
mode
Single-
Glass
Step
650
3.7/80
or 125
10
600
mode
Single-
Glass
Step
850
5/80
or 125
2.3
1000
mode
Single-
Glass
Step
1300
9.3/125
0.5
*
mode
Single-
Glass
Step
1550
8.1/125
0.2
*
mode
*
Too high to measure accurately.
Effectively infinite.
Table
2-1: Attenuation and
Bandwidth characteristics of different
fiber optic cable
candidates
Figure
2-7 illustrates the
variation of attenuation with
wavelength taken over an ensemble of
fiber optic
cable
material types. The three
principal windows of operation,
propagation through a cable,
are
indicated.
These correspond to wavelength regions
where attenuation is low and
matched to the
ability
of
a Transmitter to generate light
efficiently and a Receiver to carry
out detection. The 'OH'
symbols
indicate
that at these particular
wavelengths the presence of
Hydroxyl radicals in the cable
material
cause
a bump up in attenuation. These radicals
result from the presence of
water. They enter the
fiber
optic
cable material through either a
chemical reaction in the
manufacturing process or as humidity
in
the
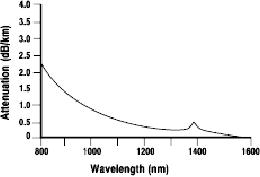
environment. The illustration
Figure 2-8 shows the
variation of attenuation with
wavelength for,
standard,
single-mode fiber optic
cable.
Figure
2-7: Attenuation vs.
Wavelength
Page
27 of 97
Figure
2-8: Attenuation spectrum of
standard single-mode
fiber
2.3
Transmitter
The
Transmitter component of Figure
2-1 serves two functions.
First, it must be a source of the
light
coupled
into the fiber optic cable.
Secondly, it must modulate
this light so as to represent the
binary data
that
it is receiving from the Source.
With the first of these
functions it is merely a light
emitter or a
source
of light. With the second of
these functions it is a valve,
generally operating by varying
the
intensity
of the light that it is
emitting and coupling into
the fiber.
Within
the context of interest in
this book the Source
provides the data to the
Transmitter as some
digital
electrical
signal. The Transmitter can
then be thought of as Electro-Optical
(EO) transducer.
First
some history. At the dawn of
fiber optic data
communications twenty-five years ago,
there was no
such
thing as a commercially available
Transmitter. The network
architect putting together a
fiber optic
data
link had to design the Transmitter
himself. Everything was
customized.
The
Transmitter was typically designed
using discrete electrical and
Electro-optical devices. This
very
quickly
gave way to designs based
upon hybrid modules
containing integrated circuits,
discrete
components
(resistors and capacitors) and optical source
diodes (light emitting
diodes-LED's or laser
diodes).
The modulation function was
generally performed using
separate integrated circuits
and
everything
was placed on the same printed
circuit board.
By
the 1980's higher and higher
data transmission speeds
were becoming of interest to
the data link
architect.
The design of the Transmitter
while still generally
customized became more
complex to
accommodate
these higher speeds. A greater
part of the Transmitter was
implemented using
VLSI
circuits
and attention was given to minimizing
the number of board interconnects.
Intense research
efforts
were undertaken to integrate
the optical source diode and the
transistor level circuits
needed for
modulation
on a common integrated circuit substrate,
without compromising performance. At
present,
the
Transmitter continues to be primarily
designed as a hybrid unit,
containing both discrete
components
and
integrated circuits in a single
package.
By
the late 1980's commercially
available Transmitter's became
available. As a result, the
link design
could
be kept separate from the
Transmitter design. The link
architect was relieved from
the need to do
high-speed
circuit design or to design proper bias
circuits for optical diodes.
The Transmitter could
generally
be looked at as a black box
selected to satisfy certain
requirements relative to
power,
wavelength,
data rate, bandwidth, etc.
This is where the situation
remains today.
Page
28 of 97
To
do a proper selection of a commercially
available Transmitter you
have to be able to know what
you
need
in order to match your other
link requirements. You have to be able to
understand the
differences
between
Transmitter candidates. There are
many. We can not begin to approach
this in total.
However,
we can look at this in a limited
way. Transmitter candidates can be
compared on the basis of
two
characteristics. Transmitter candidates
can be compared on the basis of the
optical source
component
employed and the method of
modulation.
Let
us deal with the optical source
component of the Transmitter
first. This has to meet a
number of
requirements.
These are delineated below:
First,
its physical dimensions must
be compatible with the size of
the fiber optic cable being
used. This
means
it must emit light in a cone
with cross sectional
diameter 8-100 microns, or it can
not be coupled
into
the fiber optic
cable.
Secondly,
the optical source must be able to
generate enough optical
power so that the desired
BER can
be
met.
Thirdly,
there should be high
efficiency in coupling the
light generated by the
optical source into
the
fiber
optic cable.
Fourthly,
the optical source should
have sufficient linearity to
prevent the generation of
harmonics and
intermodulation
distortion. If such interference is
generated it is extremely difficult to
remove. This
would
cancel the interference
resistance benefits of the
fiber optic cable.
Fifthly,
the optical source must be
easily modulated with an
electrical signal and must be
capable of
high-speed
modulation-or else the
bandwidth benefits of the
fiber optic cable are
lost.
Finally,
there are the usual
requirements of small size, low
weight, low cost and high
reliability. The
light
emitting junction diode stands
out as matching these
requirements. It can be modulated at
the
needed
speeds. The proper selection
of semiconductor materials and processing
techniques results in
high
optical power and efficient
coupling of it to the fiber
optic cable. These optical sources
are easily
manufactured
using standard integrated circuit
processing. This leads to low cost and
high reliability.
There
are two types of light
emitting junction diodes
that can be used as the
optical source of the
Transmitter.
These are the light emitting
diode (LED) and the laser diode (LD).
This is not the place
to
discuss
the physics of their
operation. LED's are simpler
and generate incoherent, lower
power, light.
LD's
are more complex and
generate coherent, higher
power light. Figure 2-9
illustrates the
optical
power
output, P, from each of
these devices as a function of the
electrical current input, I,
from the
modulation
circuitry. As the figure
indicates the LED has a
relatively linear P-I
characteristic while
the
LD
has a strong non-linearity or
threshold effect. The LD may
also be prone to kinks where
the power
actually
decreases with increasing
bandwidth.
With
minor exceptions, LDs have
advantages over LED's in the
following ways.
hey
can be modulated at very high
speeds.
T
They
produce greater optical
power.
They
have higher coupling
efficiency to the fiber
optic cable.

Page
29 of 97
LED's
have advantages over LD's
because they have
igher
reliability
h
better
linearity
lower
cost
Figure
2-9: LED and laser
diodes: P-I
characteristics
Both
the LED and LD generate an
optical beam with such
dimensions that it can be coupled
into a fiber
optic
cable. However, the LD produces an output
beam with much less
spatial width than an LED.
This
gives
it greater coupling efficiency. Each can be
modulated with a digital
electrical signal. For
very
high-speed
data rates the link
architect is generally driven to a
Transmitter having a LD.
When cost is a
major
issue the link architect is
generally driven to a Transmitter
having an LED.
A
key difference in the
optical output of an LED and a LD is
the wavelength spread over
which the
optical
power is distributed. The
spectral width, σλ,
is the 3 dB optical power
width (measured in nm or
microns).
The spectral width impacts
the effective transmitted
signal bandwidth. A larger
spectral width
takes
up a larger portion of the
fiber optic cable link
bandwidth. Figure 2-10
illustrates the spectral
width
of
the two devices. The optical
power generated by each
device is the area under
the curve. The
spectral
width
is the half-power spread. A LD will
always have a smaller
spectral width than a LED.
The specific
value
of the spectral width
depends on the details of
the diode structure and the
semiconductor material.
However,
typical values for a LED
are around 40 nm for
operation at 850 nm and 80 nm at 1310
nm.
Typical
values for a LD are 1 nm for
operation at 850 nm and 3 nm at 1310
nm.
Page
30 of 97
Figure
2-10: LED and laser
spectral widths
Once
a Transmitter is selected on the
basis of being either an LED
or a LD additional concerns
should
be
considered in reviewing the
specifications of the candidates. These
concerns include
packaging,
environmental
sensitivity of device characteristics,
heat sinking and reliability.
With
either an LED or LD the
Transmitter package must
have a transparent window to
transmit light
into
the fiber optic cable. It
may be packaged with either
a fiber optic cable pigtail or
with a transparent
plastic
or glass window. Some
vendors supply the
Transmitter with a package
having a small
hemispherical
lens to help focus the
light into the fiber
optic cable.
Packaging
must also address the
thermal coupling for the
LED or LD. A complete
Transmitter module
may
consume over 1 W- significant
power consumption in a small
package. Attention has to be paid
to
the
heat sinking capabilities. Plastic
packages can be used for
lower speed and lower
reliability
applications.
However, for high speed and
high reliability look for
the Transmitter to be in a
metal
package
with built-in fins for heat
sinking.
Let
us now deal with the
modulator component of the
Transmitter.
There
are several different
schemes for carrying out
the modulation function. These
are respectively:
Intensity
Modulation, Frequency Shift
Keying, Phase Shift Keying
and Polarization Modulation.
Within
the
context of a premise fiber optic
data link the only one
really employed is Intensity
Modulation. This
is
the only one that will be
described.
Intensity
Modulation also is referred to as
Amplitude Shift Keying (ASK)
and On-Off Keying
(OOK).
This
is the simplest method for
modulating the carrier
generated by the optical source.
The resulting
modulated
optical carrier is given
by:
Es(t) = Eo
m(t)
cos ( 2�fst
)
Within
the context of a premises
fiber optic data link
the modulating signal m (t),
the Information,
assumes
only the values of '0' and
'1.' The parameter 'fs' is the optical carrier
frequency. This is an
incoherent
modulation scheme. This means
that the carrier does
not have to exhibit
stability. The
demodulation
function in the Receiver will
just be looking for the
presence or absence of energy
during
a
bit time interval.
Intensity
Modulation is employed universally
for premises fiber optic
data links because it is
well
matched
to the operation of both
LED's and LD's. The carrier
that each of these sources
produce is easy
to
modulate with this
technique. Passing current
through them operates both
of these devices. The
amount
of power that they radiate
(sometimes referred to as the
radiance) is proportional to this
current.
In
this way the optical
power takes the shape of
the input current. If the
input current is the
waveform m
(t)
representing the binary
information stream then the
resulting optical signal will
look like bursts of
optical
signal when m (t) represents
a '1' and the absence of
optical signal when m(t)
represents a '0.' The
situation
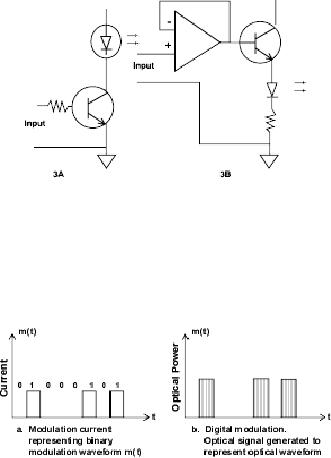
is illustrated in Figure 2-11 and
Figure 2-12. The first of
these figures shows the
essential
Page
31 of 97
Transmitter
circuitry for modulating
either an LED or LD with
Intensity Modulation. The
second of
these
figures illustrates the
input current representing
the Information and the
resulting optical
signal
generated
and provided to the fiber
optic cable.
Figure
2-11: Two methods for
modulating LEDs or
LDs
Figure
2-12: a. Input current
representing modulation waveform,
m(t); b. Output optical
signal representing m(t).
Vertical
cross
hatches indicate optical
carrier
It
must be noted that one
reason for the popularity of
Intensity Modulation is its
suitability for
operation
with
LED's. An LED can only
produce incoherent optical
power. Since Intensity Modulation
does not
require
coherence it can be used with an
LED.
2.4
Receiver
The
Receiver component of Figure
2-1 serves two functions.
First, it must sense or detect
the light
coupled
out of the fiber optic cable
then convert the light
into an electrical signal.
Secondly, it must
demodulate
this light to determine the
identity of the binary data
that it represents. In total, it must
detect
light
and then measure the
relevant Information bearing
light wave parameters in the
premises fiber
optic
data link context intensity
in order to retrieve the
Source's binary data.
Within
the realm of interest in
this book the fiber
optic cable provides the
data to the Receiver as
an
optical
signal. The Receiver then
translates it to its best estimates of
the binary data. It then
provides this
data
to the User in the form of
an electrical signal. The
Receiver can then be thought of as an
Electro-
Optical
(EO) transducer.
Page
32 of 97
A
Receiver is generally designed
with a Transmitter. Both are
modules within the same
package. The
very
heart of the Receiver is the
means for sensing the light
output of the fiber optic
cable. Light is
detected
and then converted to an electrical
signal. The demodulation
decision process is carried
out on
the
resulting electrical signal.
The light detection is
carried out by a photodiode.
This senses light and
converts
it into an electrical current.
However, the optical signal
from the fiber optic cable
and the
resulting
electrical current will have
small amplitudes. Consequently,
the photodiode circuitry
must be
followed
by one or more amplification stages.
There may even be filters
and equalizers to shape and
improve
the Information bearing
electrical signal.
All
of this active circuitry in
the Receiver presents a source of noise.
This is a source of noise whose
origin
is not the clean fiber
optic cable. Yet, this noise can
affect the demodulation
process.
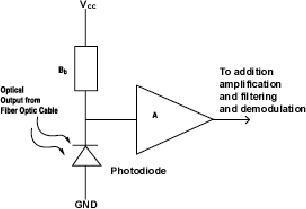
The
very heart of the Receiver
is illustrated in Figure 2-13.
This shows a photodiode,
bias resistor and a
low
noise pre-amp. The output of
the pre-amp is an electrical
waveform version of the
original
Information
out the source. To the right
of this pre-amp would be
additional amplification, filters
and
equalizers.
All of these components may be on a
single integrated circuit,
hybrid or even a
printed
circuit
board.
Figure
2-13: Example of Receiver
block diagram - first
stage
The
complete Receiver may
incorporate a number of other
functions. If the data link
is supporting
synchronous
communications this will include
clock recovery. Other
functions may included
decoding
(e.g.
4B/5B encoded information),
error detection and
recovery.
The
complete Receiver must have
high detectability, high
bandwidth and low noise. It must
have high
detectability
so that it can detect low level
optical signals coming out
of the fiber optic cable.
The higher
the
sensitivity, the more attenuated
signals it can detect. It must have
high bandwidth or fast rise
time so
that
it can respond fast enough and
demodulate, high speed,
digital data. It must have
low noise so that it
does
not significantly impact the
BER of the link and counter
the interference resistance of
the fiber
optic
cable Transmission Medium.
There
are two types of photodiode
structures; Positive Intrinsic
Negative (PIN) and the
Avalanche Photo
Diode
(APD). In most premises
applications the PIN is the
preferred element in the
Receiver. This is
mainly
due to fact that it can be operated
from a standard power supply,
typically between 5 and 15 V.
Page
33 of 97
APD
devices have much better
sensitivity. In fact it has 5 to 10 dB
more sensitivity. They also
have
twice
the bandwidth. However, they
cannot be used on a 5V printed
circuit board. They also require
a
stable
power supply. This makes
cost higher. APD devices are
usually found in long
haul
communications
links.
The
demodulation performance of the
Receiver is characterized by the
BER that it delivers to the
User.
This
is determined by the modulation
scheme - in premise applications -
Intensity modulation,
the
received
optical signal power, the
noise in the Receiver and the processing
bandwidth.
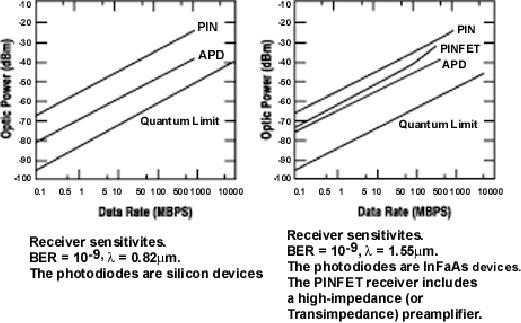
Considering
the Receiver performance is
generally characterized by a parameter
called the
sensitivity,
this
is usually a curve indicating
the minimum optical power
that the Receiver can detect
versus the data
rate,
in order to achieve a particular
BER. The sensitivity curve
varies from Receiver to
Receiver. It
subsumes
within it the signal-to-noise
ratio parameter that generally
drives all communications
link
performance.
The sensitivity depends upon
the type of photodiode
employed and the wavelength
of
operation.
Typical examples of sensitivity
curves are illustrated in
Figure 2-14.
In
examining the specification of
any Receiver you need to
look at the sensitivity
parameter. The curve
designated
Quantum Limit in Figure 2-14
is a reference. In a sense it represent
optimum performance on
the
part of the photodiode in
the Receiver. That is,
performance where there is
100% efficiency in
converting
light from the fiber
optic cable into an electric
current for
demodulation.
Figure
2-14: Receiver sensitivities
for BER = 10-9, with different
devices.
2.5
Connectors
The
Connector is a mechanical device
mounted on the end of a fiber
optic cable, light source,
Receiver
or
housing. It allows it to be mated to a
similar device. The
Transmitter provides the
Information bearing
light
to the fiber optic cable
through a connector. The
Receiver gets the
Information bearing light
from
the
fiber optic cable through a
connector. The connector
must direct light and
collect light. It must
also
Page
34 of 97
be
easily attached and detached from
equipment. This is a key
point. The connector is
disconnectable.
With
this feature it is different
than a splice which will be
discussed in the next
sub-chapter.
A
connector marks a place in the
premises fiber optic data
link where signal power can
be lost and the
BER
can be affected. It marks a place in the
premises fiber optic data
link where reliability can
be
affected
by a mechanical connection.
There
are many different connector
types. The ones for
glass fiber optic cable are
briefly described
below
and put in perspective. This is
followed by discussion of connectors
for plastic fiber optic
cable.
However,
it must be noted that the ST
connector is the most widely
used connector for premise
data
communications
Connectors
to be used with glass fiber
optic cable are listed below
in alphabetical order.
Biconic
- One of the earliest
connector types used in
fiber optic data links. It
has a tapered sleeve that
is
fixed
to the fiber optic cable.
When this plug is inserted
into its receptacle the
tapered end is a means
for
locating
the fiber optic cable in the
proper position. With this
connector, caps fit over
the ferrules, rest
against
guided rings and screw onto
the threaded sleeve to secure the
connection. This connector is
in
little
use today.
D4
- It is very similar to the FC
connector with its threaded
coupling, keying and PC end finish.
The
main
difference is its 2.0mm
diameter ferrule. Designed originally by
the Nippon Electric
Corp.
FC/PC
- Used for single-mode fiber
optic cable. It offers extremely
precise positioning of the
single-
mode
fiber optic cable with
respect to the Transmitter's
optical source emitter and the
Receiver's optical
detector.
It features a position locatable
notch and a threaded receptacle. Once
installed the position
is
maintained
with absolute
accuracy.
SC
- Used primarily with single-mode
fiber optic cables. It
offers low cost, simplicity
and durability. It
provides
for accurate alignment via
its ceramic ferrule. It is a
push on-pull off connector
with a locking
tab.
SMA
- The predecessor of the ST
connector. It features a threaded cap and
housing. The use of
this
connector
has decreased markedly in
recent years being replaced by ST and SC
connectors.
ST
- A keyed bayonet type
similar to a BNC connector. It is
used for both multi-mode and
single-mode
fiber
optic cables. Its use is
wide spread. It has the
ability both to be inserted
into and removed from
a
fiber
optic cable both quickly and
easily. Method of location is also easy.
There are two versions ST
and
ST-II.
These are keyed and spring loaded.
They are push-in and twist
types.
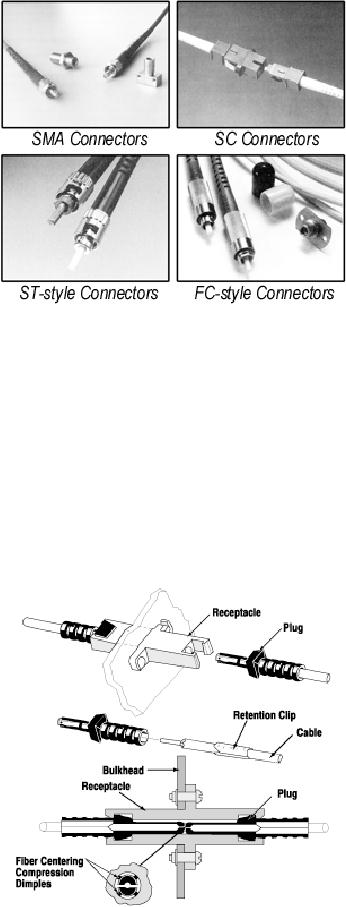
Photographs
of several of these connectors
are provided in Figure
2-15.
Page
35 of 97
Figure
2-15: Common connectors for
glass fiber optic cable
(Courtesy of AMP
Incorporated)
Plastic
Fiber Optic Cable Connectors -
Connectors that are
exclusively used for plastic
fiber optic cable
stress
very low cost and easy
application. Often used in
applications with no polishing or
epoxy. Figure
2-16
illustrates such a connector.
Connectors for plastic fiber
optic cable include both
proprietary
designs
and standard designs. Connectors used for
glass fiber optic cable,
such as ST or SMA are
also
available
for use with plastic
fiber optic cable. As plastic
fiber optic cable gains in popularity in
the data
communications
world there will be undoubtedly greater
standardization.
Figure
2-16: Plastic fiber optic
cable connector (Illustration courtesy of
AMP Incorporated)
Page
36 of 97
2.6
Splicing
A
splice is a device to connect one
fiber optic cable to another
permanently. It is the attribute
of
permanence
that distinguishes a splice
from connectors. Nonetheless,
some vendors offer splices
that
can
be disconnected that are not
permanent so that they can be
disconnected for repairs or
rearrangements.
The terminology can get
confusing.
Fiber
optic cables may have to be
spliced together for any of
a number of reasons.
One
reason is to realize a link of a
particular length. The
network installer may have
in his inventory
several
fiber optic cables but,
none long enough to satisfy
the required link length.
This may easily
arise
since
cable manufacturers offer cables in
limited lengths - usually 1 to 6
km. If a link of 10 km has to
be
installed
this can be done by splicing several
together. The installer may
then satisfy the
distance
requirement
and not have to buy a new
fiber optic cable.
Splices
may be required at building entrances,
wiring closets, couplers and literally
any intermediary
point
between Transmitter and
Receiver.
At
first glance you may
think that splicing two
fiber optic cables together
is like connecting two
wires.
To
the contrary, the
requirements for a fiber-optic
connection and a wire connection
are very different.
Two
copper connectors can be joined by solder
or by connectors that have
been crimped or soldered to
the
wires. The purpose is to create an
intimate contact between the
mated halves in order to have a
low
resistance
path across a junction. On
the other hand, connecting
two fiber optic cables
requires precise
alignment
of the mated fiber cores or
spots in a single-mode fiber
optic cable. This is demanded so
that
nearly
all of the light is coupled
from one fiber optic cable
across a junction to the
other fiber optic
cable.
Actual contact between the
fiber optic cables is not
even mandatory. The need
for precise
alignment
creates a challenge to a designer of a
splice.
There
are two principal types of
splices: fusion and
mechanical.
Fusion
splices - uses an electric arc to weld
two fiber optic cables
together. The splices
offer
sophisticated,
computer controlled alignment of
fiber optic cables to
achieve losses as low as
0.05 dB.
This
comes at a high cost.
Mechanical-splices
all share common elements.
They are easily applied in
the field, require little or
no
tooling
and offer losses of about
0.2 dB.
2.7
Analyzing Performance of a
Link
You
have a tentative design for a
fiber optic data link of
the type that is being
dealt with in this
chapter,
the
type illustrated in Figure
2-1. You want to know
whether this tentative design will
satisfy your
performance
requirements.
You
characterize your performance
requirements by BER. This
generally depends upon the
specific
Source-User
application. This could be as
high as 10-3 for applications like
digitized voice or as low
as
10-10 for
scientific data. The
tendency though has been to
require lower and lower
BERs.
The
question then is will the
tentative fiber optic link
design provide the required
BER? The answer to
Page
37 of 97
this
question hinges on the
sensitivity of the Receiver
that you have chosen for
your fiber optic data
link
design.
This indicates how much
received optical power must
appear at the Receiver in
order to deliver
the
required BER.
To
determine whether your
tentative fiber optic link
design can meet the sensitivity you
must analyze it.
You
must determine how much
power does reach the
Receiver. This is done with a
fiber optic data
link
power
budget.
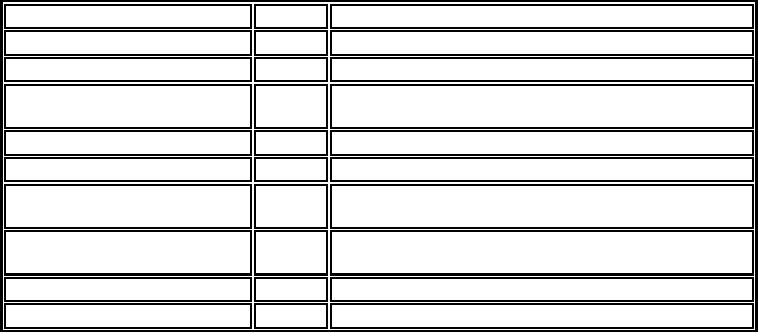
A
power budget for a
particular example is presented in
Table 2-2 below and is then
discussed. This
example
corresponds to the design of a fiber
optic data link with
the following
attributes:
1.
Data
Rate of 50 MBPS.
2.
BER
of 10-9.
3.
Link
length of 5 km (premises distances).
4.
Multi-mode,
step index, glass fiber
optic cable having dimensions
62.5/125.Transmitter uses
LED
at
850 nm.
5.
Receiver uses PIN and has
sensitivity of -40 dBm at 50
MBPS.
6.
Fiber optic cable has 1
splice.
LINK
ELEMENT
VALUE
COMMENTS
Transmitter
LED output power 3
dBm
Specified
value by vendor
Source
coupling loss
-5
dB
Accounts
for reflections, area
mismatch etc.
Transmitter
to fiber optic cable
Transmitter
to fiber optic cable with ST
connector. Loss
-1
dB
connector
loss
accounts
for misalignment
Splice
loss
-0.25
dB
Mechanical
splice
Fiber
Optic Cable Attenuation
-20
dB
Line
2 of Table 2-1 applied to 5
km
Fiber
optic cable to receiver
Fiber
optic cable to Receiver with ST
connector. Loss
-1
dB
connector
loss
Accounts
for misalignment
Optical
Power Delivered at
-24.25
Receiver
dB
Receiver
Sensitivity
-40
dBm
Specified
in link design. Consistent with
Figure 2-14
LOSS
MARGIN
15.75
dB
Table
2-2: Example Power Budget
for a fiber optic data
link
The
entries in Table 2-2 are
more or less self-explanatory.
Clearly, the optical power
at the Receiver is
greater
than that required by the
sensitivity of the PIN to
give the required BER.
What is important to
note
is the entry termed Loss
Margin? This specifies the
amount by which the received
optical power
exceeds
the required sensitivity. In
this example it is 15.75 dB.
Good design practice requires it to be
at
least
10 dB. Why? Because no
matter how careful the
power budget is put
together, entries are
always
forgotten,
are too optimistic or vendor
specifications are not
accurate.
CHAPTER
3
EXPLOITING
THE BANDWIDTH OF FIBER OPTIC CABLE-
Table of Contents:
- Introduction:The Fundamental Problem of Communication, Program
- The Fiber Optic Data Communications Link For the Premises Environment:Fiber Optic Cable
- Exploiting The Bandwidth Of Fiber Optic Cable-Employment by Multiple Users:Sharing the Transmission Medium
- Exploiting The Delay Properties Of Fiber Optic Cable For LAN Extension:Brief History of Local Area Networks
- Exploiting The Advantages Of Fiber Optic Cable In the Industrial Environment:The Problem of Interference
- Serial Data Communications Over Fiber Optic Cable
- Standards
- Glossary